Inventory Watch: July 4, 2022

This should be about it.
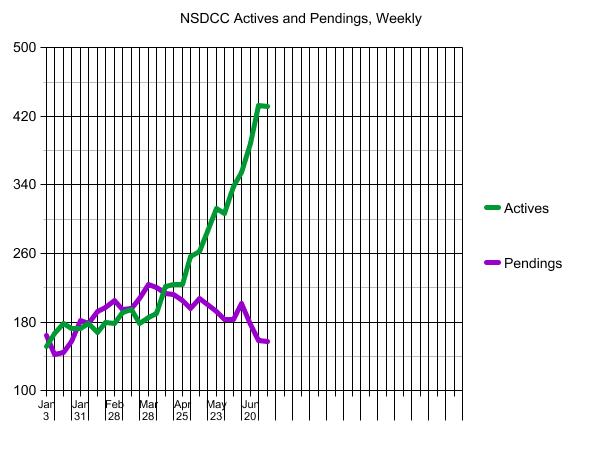
If there hasn’t been a surge of inventory by now, it’s not coming – at least not this year.
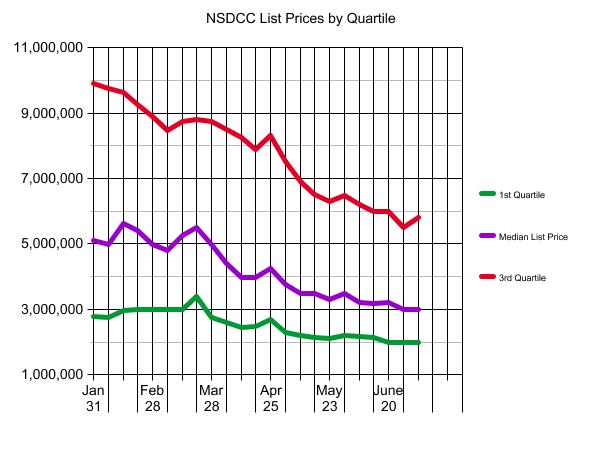
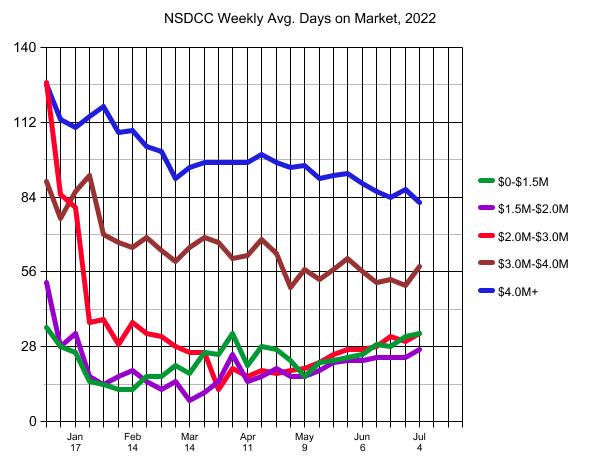
There might be some nice action over the next couple of weeks as buyers try to land a deal before school starts, but there won’t be big discounts – they will have to pay the price.
It will probably be the same in 2023 too.
How do I know?
Ask any potential, or actual, home sellers around the coast:
“You already have to pay six figures in capital-gains taxes when selling your home (and if they are selling a home they have owned since the 1970s or 1980s, it could be $500,000 to $1,000,000 in taxes).
“How do you feel about lowering your price by $100,000 or $200,000 too?”
“How do you feel about losing that much money?”
Their answer will tell you everything about the future of our market – they’re not going to give it away!


It’s been the craziest six months of real estate ever! Expect it to get downright boring from here.
~~~~~~~~~~~~~~~~~~~~~~~~~~~~~~~~~~~
The $0 – $1,500,000 Market:
| Date |
NSDCC Active Listings |
Avg. LP/sf |
Avg. DOM |
# of Pendings |
| Jan 3, 2022 |
9 |
$832/sf |
35 |
36 |
| Jan 10 |
9 |
$766/sf |
28 |
29 |
| Jan 17 |
13 |
$773/sf |
26 |
27 |
| Jan 24 |
9 |
$818/sf |
15 |
29 |
| Jan 31 |
14 |
$752/sf |
14 |
31 |
| Feb 7 |
13 |
$774/sf |
12 |
32 |
| Feb 14 |
11 |
$826/sf |
12 |
35 |
| Feb 21 |
7 |
$889/sf |
17 |
38 |
| Feb 28 |
12 |
$888/sf |
17 |
33 |
| Mar 7 |
9 |
$1,017/sf |
21 |
33 |
| Mar 14 |
14 |
$847/sf |
18 |
31 |
| Mar 21 |
8 |
$912/sf |
26 |
36 |
| Mar 28 |
10 |
$914/sf |
25 |
28 |
| Apr 4 |
10 |
$782/sf |
33 |
34 |
| Apr 11 |
19 |
$733/sf |
21 |
36 |
| Apr 18 |
16 |
$795/sf |
28 |
34 |
| Apr 25 |
18 |
$891/sf |
27 |
30 |
| May 2 |
22 |
$822/sf |
23 |
31 |
| May 9 |
24 |
$887/sf |
17 |
46 |
| May 16 |
25 |
$783/sf |
22 |
25 |
| May 23 |
29 |
$782/sf |
23 |
29 |
| May 30 |
30 |
$782/sf |
24 |
28 |
| Jun 6 |
34 |
$763/sf |
25 |
28 |
| Jun 13 |
33 |
$802/sf |
29 |
29 |
| Jun 20 |
48 |
$774/sf |
28 |
22 |
| Jun 27 |
43 |
$755/sf |
32 |
22 |
| Jul 4 |
49 |
$757/sf |
33 |
23 |
The $1,500,000 – $2,000,000 Market:
| Date |
NSDCC Active Listings |
Avg. LP/sf |
Avg. DOM |
# of Pendings |
| Jan 3, 2022 |
8 |
$842/sf |
52 |
36 |
| Jan 10 |
13 |
$751/sf |
28 |
29 |
| Jan 17 |
16 |
$736/sf |
33 |
27 |
| Jan 24 |
16 |
$801/sf |
17 |
27 |
| Jan 31 |
15 |
$696/sf |
14 |
34 |
| Feb 7 |
15 |
$765/sf |
17 |
34 |
| Feb 14 |
10 |
$726/sf |
19 |
38 |
| Feb 21 |
19 |
$715/sf |
15 |
39 |
| Feb 28 |
9 |
$660/sf |
12 |
46 |
| Mar 7 |
16 |
$789/sf |
15 |
46 |
| Mar 14 |
17 |
$837/sf |
8 |
44 |
| Mar 21 |
18 |
$867/sf |
11 |
43 |
| Mar 28 |
14 |
$838/sf |
15 |
48 |
| Apr 4 |
18 |
$762/sf |
25 |
42 |
| Apr 11 |
23 |
$774/sf |
15 |
39 |
| Apr 18 |
22 |
$792/sf |
17 |
41 |
| Apr 25 |
18 |
$810/sf |
20 |
41 |
| May 2 |
27 |
$809/sf |
17 |
37 |
| May 9 |
33 |
$837/sf |
17 |
46 |
| May 16 |
39 |
$793/sf |
19 |
44 |
| May 23 |
43 |
$793/sf |
22 |
44 |
| May 30 |
36 |
$843/sf |
23 |
36 |
| Jun 6 |
43 |
$817/sf |
23 |
41 |
| Jun 13 |
49 |
$845/sf |
24 |
42 |
| Jun 20 |
57 |
$817/sf |
24 |
41 |
| Jun 27 |
75 |
$807/sf |
24 |
35 |
| Jul 4 |
70 |
$827/sf |
27 |
33 |
The $2,000,000 – $3,000,000 Market:
| Date |
NSDCC Active Listings |
Avg. LP/sf |
Avg. DOM |
# of Pendings |
| Jan 3, 2022 |
18 |
$1,080/sf |
127 |
43 |
| Jan 10 |
23 |
$1,038/sf |
85 |
37 |
| Jan 17 |
26 |
$1,044/sf |
80 |
41 |
| Jan 24 |
28 |
$1,015/sf |
37 |
42 |
| Jan 31 |
22 |
$949/sf |
38 |
47 |
| Feb 7 |
26 |
$919/sf |
29 |
42 |
| Feb 14 |
22 |
$997/sf |
37 |
49 |
| Feb 21 |
21 |
$966/sf |
33 |
54 |
| Feb 28 |
26 |
$905/sf |
32 |
57 |
| Mar 7 |
29 |
$922/sf |
28 |
57 |
| Mar 14 |
20 |
$852/sf |
26 |
58 |
| Mar 21 |
17 |
$928/sf |
26 |
60 |
| Mar 28 |
34 |
$927/sf |
12 |
65 |
| Apr 4 |
32 |
$927/sf |
20 |
69 |
| Apr 11 |
44 |
$910/sf |
17 |
62 |
| Apr 18 |
48 |
$997/sf |
19 |
66 |
| Apr 25 |
42 |
$1,092/sf |
18 |
73 |
| May 2 |
54 |
$995/sf |
19 |
70 |
| May 9 |
61 |
$910/sf |
20 |
73 |
| May 16 |
64 |
$977/sf |
22 |
69 |
| May 23 |
82 |
$953/sf |
25 |
59 |
| May 30 |
78 |
$951/sf |
27 |
56 |
| Jun 6 |
94 |
$963/sf |
27 |
58 |
| Jun 13 |
98 |
$961/sf |
28 |
70 |
| Jun 20 |
91 |
$935/sf |
32 |
59 |
| Jun 27 |
111 |
$894/sf |
30 |
60 |
| Jul |
112 |
$910/sf |
33 |
60 |
The $3,000,000 – $4,000,000 Market:
| Date |
NSDCC Active Listings |
Avg. LP/sf |
Avg. DOM |
# of Pendings |
| Jan 3, 2022 |
19 |
$1,230/sf |
90 |
26 |
| Jan 10 |
22 |
$1,210/sf |
76 |
25 |
| Jan 17 |
19 |
$1,207/sf |
86 |
23 |
| Jan 24 |
17 |
$1,129/sf |
92 |
24 |
| Jan 31 |
21 |
$1,172/sf |
70 |
22 |
| Feb 7 |
19 |
$1,169/sf |
67 |
25 |
| Feb 14 |
19 |
$1,234/sf |
65 |
28 |
| Feb 21 |
21 |
$1,279/sf |
69 |
28 |
| Feb 28 |
22 |
$1,214/sf |
64 |
25 |
| Mar 7 |
27 |
$1,295/sf |
60 |
24 |
| Mar 14 |
27 |
$1,201/sf |
65 |
27 |
| Mar 21 |
23 |
$1,282/sf |
69 |
31 |
| Mar 28 |
25 |
$1,253/sf |
67 |
30 |
| Apr 4 |
30 |
$1,199/sf |
61 |
27 |
| Apr 11 |
32 |
$1,174/sf |
62 |
31 |
| Apr 18 |
33 |
$1,216/sf |
68 |
31 |
| Apr 25 |
33 |
$1,219/sf |
63 |
33 |
| May 2 |
37 |
$1,164/sf |
50 |
36 |
| May 9 |
33 |
$1,132/sf |
57 |
32 |
| May 16 |
40 |
$1,119/sf |
53 |
32 |
| May 23 |
40 |
$1,135/sf |
57 |
27 |
| May 30 |
40 |
$1,178/sf |
61 |
28 |
| Jun 6 |
43 |
$1,224/sf |
56 |
28 |
| Jun 13 |
48 |
$1,184/sf |
52 |
28 |
| Jun 20 |
52 |
$1,117/sf |
53 |
26 |
| Jun 27 |
60 |
$1,120/sf |
51 |
19 |
| Jul 4 |
55 |
$1,127/sf |
58 |
23 |
The $4,000,000+ Market:
| Date |
NSDCC Active Listings |
Avg. LP/sf |
Avg. DOM |
# of Pendings |
| Jan 3, 2022 |
100 |
$1,884/sf |
128 |
30 |
| Jan 10 |
105 |
$1,864/sf |
113 |
29 |
| Jan 17 |
109 |
$1,763/sf |
110 |
34 |
| Jan 24 |
105 |
$2,130/sf |
114 |
42 |
| Jan 31 |
102 |
$2,114/sf |
118 |
53 |
| Feb 7 |
109 |
$2,000/sf |
108 |
50 |
| Feb 14 |
108 |
$2,005/sf |
109 |
47 |
| Feb 21 |
113 |
$2,008/sf |
103 |
43 |
| Feb 28 |
111 |
$1,991/sf |
101 |
47 |
| Mar 7 |
115 |
$1,904/sf |
91 |
39 |
| Mar 14 |
121 |
$1,893/sf |
95 |
43 |
| Mar 21 |
116 |
$1,905/sf |
97 |
44 |
| Mar 28 |
104 |
$1,966/sf |
97 |
59 |
| Apr 4 |
103 |
$1,929/sf |
97 |
56 |
| Apr 11 |
106 |
$1,906/sf |
97 |
55 |
| Apr 18 |
108 |
$1,874/sf |
100 |
51 |
| Apr 25 |
116 |
$1,829/sf |
97 |
38 |
| May 2 |
117 |
$1,781/sf |
95 |
32 |
| May 9 |
116 |
$1,831/sf |
96 |
36 |
| May 16 |
124 |
$1,854/sf |
91 |
39 |
| May 23 |
125 |
$1,855/sf |
92 |
36 |
| May 30 |
129 |
$1,706/sf |
93 |
39 |
| Jun 6 |
131 |
$1,740/sf |
89 |
33 |
| Jun 13 |
132 |
$1,793/sf |
86 |
38 |
| Jun 20 |
148 |
$1,772/sf |
84 |
35 |
| Jun 27 |
153 |
$1,779/sf |
87 |
29 |
| Jul 4 |
155 |
$1,777/sf |
82 |
25 |
NSDCC Weekly New Listings and New Pendings
| Week |
New Listings |
New Pendings |
Total Actives |
Total Pendings |
| Jan 3, 2022 |
17 |
14 |
152 |
164 |
| Jan 10 |
39 |
18 |
167 |
142 |
| Jan 17 |
34 |
29 |
179 |
145 |
| Jan 24 |
41 |
40 |
173 |
157 |
| Jan 31 |
43 |
40 |
173 |
182 |
| Feb 7 |
43 |
38 |
179 |
179 |
| Feb 14 |
44 |
49 |
168 |
193 |
| Feb 21 |
51 |
38 |
180 |
197 |
| Feb 28 |
39 |
39 |
179 |
205 |
| Mar 7 |
54 |
37 |
191 |
195 |
| Mar 14 |
48 |
51 |
195 |
196 |
| Mar 21 |
39 |
46 |
178 |
207 |
| Mar 28 |
53 |
50 |
185 |
224 |
| Apr 4 |
46 |
40 |
190 |
220 |
| Apr 11 |
61 |
39 |
221 |
213 |
| Apr 18 |
41 |
46 |
224 |
212 |
| Apr 25 |
50 |
43 |
224 |
205 |
| May 2 |
76 |
37 |
256 |
196 |
| May 9 |
59 |
46 |
262 |
207 |
| May 16 |
78 |
48 |
286 |
200 |
| May 23 |
61 |
42 |
312 |
192 |
| May 30 |
54 |
44 |
307 |
183 |
| Jun 6 |
70 |
31 |
338 |
183 |
| Jun 13 |
60 |
41 |
354 |
202 |
| Jun 20 |
71 |
25 |
388 |
177 |
| Jun 27 |
73 |
26 |
433 |
159 |
| Jul 4 |
55 |
39 |
432 |
158 |


