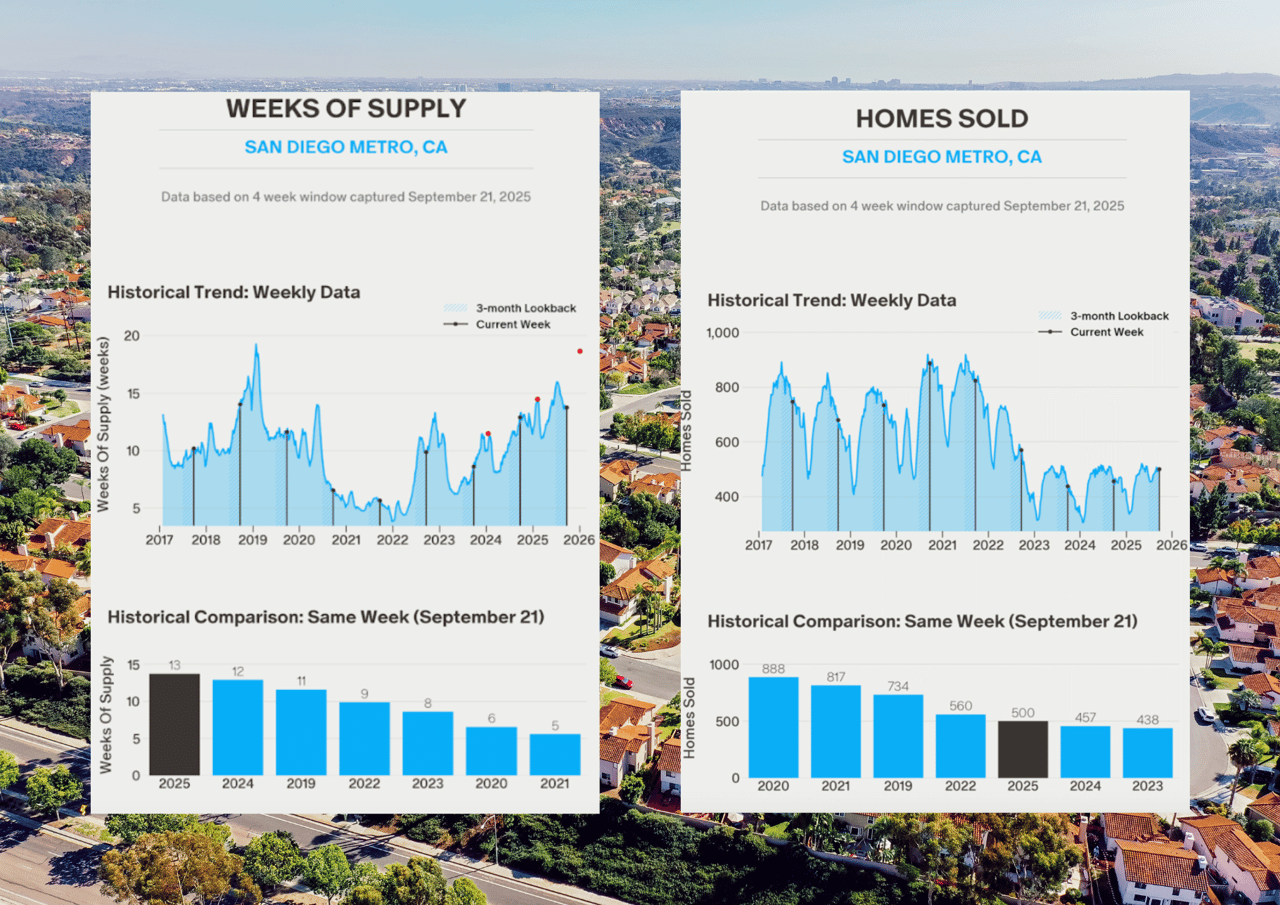
Inventory Watch: November 3rd
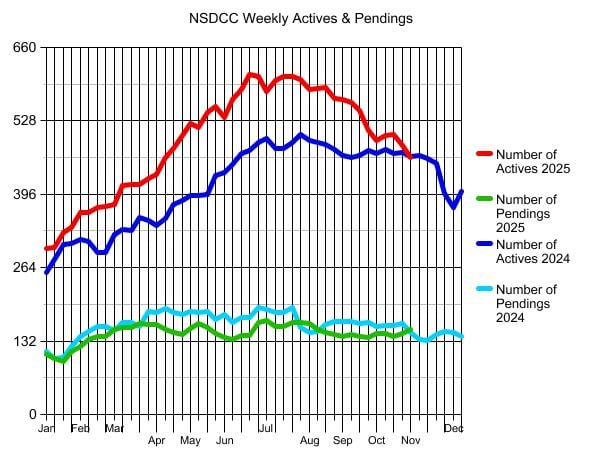
On the day that the number of homes for sale between La Jolla and Carlsbad dips below last year’s count for the first time in 2025, the number of pendings rise up again and exceed the 2024 count too! A late-season rally!
Too bad there aren’t many new listings – this would be a great time to sell!
The U.S. Supreme Court is hearing arguments on Wednesday about the Trump tariffs – which have been one of the main reasons why bond yields haven’t dropped more. If something good comes out of that and bond traders relax a bit about inflation, we might finally see the lowest rates of the year too.
I’m a patient guy – all I want and need is mortgage rates in the mid-5s by January!
The $0 – $2,000,000 Market:
| Date |
NSDCC Active Listings |
Avg. LP/sf |
Avg. DOM |
# of Pendings |
| Jan 6, 2025 |
43 |
$918/sf |
63 |
27 |
| Jan 13 |
45 |
$936/sf |
53 |
22 |
| Jan 20 |
47 |
$908/sf |
54 |
25 |
| Jan 27 |
48 |
$904/sf |
48 |
32 |
| Feb 3 |
51 |
$914/sf |
47 |
41 |
| Feb 10 |
45 |
$935/sf |
46 |
45 |
| Feb 17 |
45 |
$916/sf |
46 |
46 |
| Feb 24 |
45 |
$958/sf |
48 |
40 |
| Mar 3 |
50 |
$950/sf |
37 |
42 |
| Mar 10 |
55 |
$908/sf |
36 |
45 |
| Mar 17 |
53 |
$891/sf |
35 |
50 |
| Mar 24 |
53 |
$898/sf |
30 |
51 |
| Mar 31 |
58 |
$878/sf |
35 |
44 |
| Apr 7 |
56 |
$867/sf |
30 |
43 |
| Apr 14 |
63 |
$906/sf |
32 |
40 |
| Apr 21 |
59 |
$936/sf |
35 |
37 |
| Apr 28 |
74 |
$899/sf |
32 |
39 |
| May 5 |
83 |
$907/sf |
30 |
47 |
| May 12 |
72 |
$916/sf |
34 |
44 |
| May 19 |
70 |
$898/sf |
38 |
51 |
| May 26 |
74 |
$923/sf |
39 |
43 |
| Jun 2 |
76 |
$912/sf |
39 |
36 |
| Jun 9 |
87 |
$939/sf |
38 |
36 |
| Jun 16 |
83 |
$922/sf |
41 |
48 |
| Jun 23 |
89 |
$930/sf |
46 |
52 |
| Jun 30 |
96 |
$938/sf |
42 |
57 |
| Jul 7 |
83 |
$944/sf |
45 |
63 |
| Jul 14 |
94 |
$910/sf |
47 |
53 |
| Jul 21 |
104 |
$897/sf |
45 |
49 |
| Jul 28 |
102 |
$882/sf |
48 |
51 |
| Aug 4 |
106 |
$858/sf |
50 |
47 |
| Aug 11 |
107 |
$864/sf |
50 |
44 |
| Aug 18 |
110 |
$836/sf |
51 |
42 |
| Aug 25 |
115 |
$843/sf |
47 |
49 |
| Sep 1 |
101 |
$832/sf |
52 |
49 |
| Sep 8 |
106 |
$837/sf |
50 |
46 |
| Sep 15 |
102 |
$829/sf |
54 |
48 |
| Sep 22 |
105 |
$839/sf |
56 |
44 |
| Sep 29 |
98 |
$830/sf |
53 |
38 |
| Oct 6 |
96 |
$828/sf |
53 |
38 |
| Oct 13 |
100 |
$811/sf |
55 |
45 |
| Oct 20 |
96 |
$842/sf |
51 |
38 |
| Oct 27 |
93 |
$862/sf |
53 |
43 |
| Nov 3 |
84 |
$833/sf |
48 |
49 |
The $2,000,000 – $3,000,000 Market:
| Date |
NSDCC Active Listings |
Avg. LP/sf |
Avg. DOM |
# of Pendings |
| Jan 6, 2025 |
55 |
$1,029/sf |
66 |
36 |
| Jan 13 |
58 |
$990/sf |
63 |
31 |
| Jan 20 |
64 |
$1,018/sf |
57 |
39 |
| Jan 27 |
64 |
$1,025/sf |
53 |
31 |
| Feb 3 |
71 |
$1,009/sf |
50 |
31 |
| Feb 10 |
75 |
$1,005/sf |
46 |
36 |
| Feb 17 |
81 |
$1,015/sf |
44 |
39 |
| Feb 24 |
80 |
$1,012/sf |
38 |
52 |
| Mar 3 |
80 |
$1,034/sf |
33 |
49 |
| Mar 10 |
92 |
$1,029/sf |
37 |
44 |
| Mar 17 |
98 |
$1,015/sf |
39 |
44 |
| Mar 24 |
98 |
$1,008/sf |
41 |
52 |
| Mar 31 |
100 |
$997/sf |
44 |
54 |
| Apr 7 |
94 |
$940/sf |
43 |
54 |
| Apr 14 |
96 |
$962/sf |
42 |
53 |
| Apr 21 |
107 |
$1,000/sf |
43 |
53 |
| Apr 28 |
109 |
$1,010/sf |
44 |
49 |
| May 5 |
124 |
$1,036/sf |
40 |
50 |
| May 12 |
120 |
$1,041/sf |
43 |
57 |
| May 19 |
133 |
$1,034/sf |
43 |
49 |
| May 26 |
133 |
$1,055/sf |
47 |
53 |
| Jun 2 |
140 |
$1,039/sf |
48 |
51 |
| Jun 9 |
149 |
$1,042/sf |
45 |
45 |
| Jun 16 |
157 |
$1,043/sf |
46 |
44 |
| Jun 23 |
163 |
$1,028/sf |
45 |
43 |
| Jun 30 |
156 |
$1,030/sf |
45 |
46 |
| Jul 7 |
144 |
$1,048/sf |
47 |
46 |
| Jul 14 |
156 |
$1,023/sf |
46 |
45 |
| Jul 21 |
154 |
$1,018/sf |
45 |
54 |
| Jul 28 |
149 |
$1,021/sf |
50 |
56 |
| Aug 4 |
144 |
$1,031/sf |
48 |
60 |
| Aug 11 |
133 |
$1,054/sf |
58 |
62 |
| Aug 18 |
133 |
$1,046/sf |
57 |
54 |
| Aug 25 |
131 |
$1,020/sf |
58 |
46 |
| Sep 1 |
123 |
$1,060/sf |
58 |
44 |
| Sep 8 |
121 |
$1,080/sf |
55 |
43 |
| Sep 15 |
124 |
$1,079/sf |
58 |
42 |
| Sep 22 |
119 |
$1,052/sf |
56 |
48 |
| Sep 29 |
107 |
$1,074/sf |
60 |
47 |
| Oct 6 |
99 |
$1,073/sf |
58 |
55 |
| Oct 13 |
100 |
$1,073/sf |
60 |
46 |
| Oct 20 |
106 |
$1,044/sf |
60 |
47 |
| Oct 27 |
94 |
$1,037/sf |
65 |
51 |
| Nov 3 |
92 |
$1,051/sf |
64 |
52 |
The $3,000,000 – $4,000,000 Market:
| Date |
NSDCC Active Listings |
Avg. LP/sf |
Avg. DOM |
# of Pendings |
| Jan 6, 2025 |
44 |
$1,091/sf |
82 |
19 |
| Jan 13 |
46 |
$1,122/sf |
77 |
19 |
| Jan 20 |
52 |
$1,156/sf |
70 |
16 |
| Jan 27 |
49 |
$1,197/sf |
67 |
20 |
| Feb 3 |
56 |
$1,182/sf |
55 |
21 |
| Feb 10 |
58 |
$1,158/sf |
51 |
25 |
| Feb 17 |
58 |
$1,179/sf |
54 |
24 |
| Feb 24 |
56 |
$1,168/sf |
52 |
24 |
| Mar 3 |
51 |
$1,147/sf |
56 |
31 |
| Mar 10 |
56 |
$1,240/sf |
61 |
34 |
| Mar 17 |
60 |
$1,209/sf |
61 |
36 |
| Mar 24 |
60 |
$1,209/sf |
62 |
39 |
| Mar 31 |
62 |
$1,158/sf |
64 |
34 |
| Apr 7 |
68 |
$1,208/sf |
59 |
34 |
| Apr 14 |
79 |
$1,193/sf |
55 |
26 |
| Apr 21 |
85 |
$1,230/sf |
54 |
28 |
| Apr 28 |
85 |
$1,198/sf |
53 |
28 |
| May 5 |
82 |
$1,179/sf |
56 |
28 |
| May 12 |
89 |
$1,148/sf |
53 |
30 |
| May 19 |
88 |
$1,161/sf |
56 |
28 |
| May 26 |
85 |
$1,157/sf |
58 |
26 |
| Jun 2 |
81 |
$1,162/sf |
58 |
22 |
| Jun 9 |
89 |
$1,146/sf |
58 |
21 |
| Jun 16 |
95 |
$1,107/sf |
56 |
17 |
| Jun 23 |
101 |
$1,146/sf |
58 |
18 |
| Jun 30 |
102 |
$1,192/sf |
56 |
24 |
| Jul 7 |
102 |
$1,176/sf |
55 |
21 |
| Jul 14 |
108 |
$1,174/sf |
55 |
20 |
| Jul 21 |
105 |
$1,212/sf |
57 |
17 |
| Jul 28 |
114 |
$1,211/sf |
55 |
16 |
| Aug 4 |
111 |
$1,221/sf |
56 |
15 |
| Aug 11 |
105 |
$1,277/sf |
58 |
19 |
| Aug 18 |
104 |
$1,271/sf |
57 |
17 |
| Aug 25 |
101 |
$1,284/sf |
61 |
18 |
| Sep 1 |
101 |
$1,285/sf |
66 |
17 |
| Sep 8 |
95 |
$1,262/sf |
69 |
18 |
| Sep 15 |
95 |
$1,282/sf |
70 |
16 |
| Sep 22 |
90 |
$1,300/sf |
74 |
21 |
| Sep 29 |
84 |
$1,300/sf |
75 |
24 |
| Oct 6 |
85 |
$1,275/sf |
74 |
19 |
| Oct 13 |
89 |
$1,275/sf |
73 |
21 |
| Oct 20 |
92 |
$1,272/sf |
72 |
19 |
| Oct 27 |
97 |
$1,259/sf |
73 |
17 |
| Nov 3 |
88 |
$1,233/sf |
73 |
20 |
The $4,000,000+ Market:
| Date |
NSDCC Active Listings |
Avg. LP/sf |
Avg. DOM |
# of Pendings |
| Jan 6, 2025 |
160 |
$1,822/sf |
105 |
27 |
| Jan 13 |
156 |
$1,868/sf |
105 |
31 |
| Jan 20 |
170 |
$1,936/sf |
95 |
29 |
| Jan 27 |
180 |
$1,877/sf |
90 |
31 |
| Feb 3 |
189 |
$1,884/sf |
85 |
31 |
| Feb 10 |
189 |
$1,864/sf |
88 |
29 |
| Feb 17 |
192 |
$1,875/sf |
90 |
32 |
| Feb 24 |
195 |
$1,869/sf |
91 |
34 |
| Mar 3 |
200 |
$1,860/sf |
87 |
34 |
| Mar 10 |
213 |
$1,811/sf |
83 |
36 |
| Mar 17 |
208 |
$1,755/sf |
85 |
30 |
| Mar 24 |
211 |
$1,800/sf |
86 |
25 |
| Mar 31 |
213 |
$1,784/sf |
90 |
32 |
| Apr 7 |
219 |
$1,777/sf |
90 |
33 |
| Apr 14 |
230 |
$1,790/sf |
87 |
35 |
| Apr 21 |
231 |
$1,792/sf |
87 |
32 |
| Apr 28 |
235 |
$1,772/sf |
88 |
28 |
| May 5 |
239 |
$1,811/sf |
82 |
30 |
| May 12 |
239 |
$1,811/sf |
85 |
33 |
| May 19 |
255 |
$1,773/sf |
85 |
29 |
| May 26 |
265 |
$1,759/sf |
87 |
24 |
| Jun 2 |
242 |
$1,745/sf |
90 |
29 |
| Jun 9 |
244 |
$1,774/sf |
90 |
33 |
| Jun 16 |
254 |
$1,766/sf |
88 |
34 |
| Jun 23 |
265 |
$1,787/sf |
91 |
30 |
| Jun 30 |
260 |
$1,786/sf |
92 |
40 |
| Jul 7 |
257 |
$1,720/sf |
95 |
41 |
| Jul 14 |
250 |
$1,749/sf |
101 |
45 |
| Jul 21 |
249 |
$1,738/sf |
102 |
44 |
| Jul 28 |
249 |
$1,731/sf |
104 |
47 |
| Aug 4 |
245 |
$1,748/sf |
106 |
46 |
| Aug 11 |
243 |
$1,758/sf |
109 |
41 |
| Aug 18 |
244 |
$1,738/sf |
110 |
40 |
| Aug 25 |
244 |
$1,745/sf |
112 |
36 |
| Sep 1 |
247 |
$1,759/sf |
111 |
35 |
| Sep 8 |
248 |
$1,751/sf |
109 |
34 |
| Sep 15 |
243 |
$1,775/sf |
109 |
38 |
| Sep 22 |
237 |
$1,806/sf |
110 |
29 |
| Sep 29 |
226 |
$1,812/sf |
113 |
31 |
| Oct 6 |
218 |
$1,841/sf |
114 |
35 |
| Oct 13 |
219 |
$1,822/sf |
112 |
35 |
| Oct 20 |
216 |
$1,797/sf |
111 |
37 |
| Oct 27 |
209 |
$1,734/sf |
114 |
38 |
| Nov 3 |
208 |
$1,728/sf |
109 |
36 |
NSDCC Weekly New Listings and New Pendings
| Week |
New Listings |
New Pendings |
Total Actives |
Total Pendings |
| Jan 6 |
27 |
11 |
298 |
108 |
| Jan 13 |
38 |
26 |
301 |
101 |
| Jan 20 |
55 |
16 |
328 |
95 |
| Jan 27 |
60 |
32 |
337 |
113 |
| Feb 3 |
72 |
28 |
363 |
123 |
| Feb 10 |
50 |
34 |
364 |
135 |
| Feb 17 |
50 |
29 |
373 |
140 |
| Feb 24 |
58 |
38 |
374 |
148 |
| Mar 3 |
60 |
31 |
378 |
152 |
| Mar 10 |
60 |
30 |
411 |
156 |
| Mar 17 |
49 |
37 |
413 |
157 |
| Mar 24 |
57 |
39 |
414 |
164 |
| Mar 31 |
47 |
27 |
425 |
162 |
| Apr 7 |
52 |
31 |
431 |
162 |
| Apr 14 |
70 |
28 |
462 |
153 |
| Apr 21 |
58 |
24 |
478 |
148 |
| Apr 28 |
71 |
30 |
501 |
143 |
| May 5 |
82 |
37 |
524 |
154 |
| May 12 |
56 |
39 |
516 |
163 |
| May 19 |
54 |
20 |
543 |
156 |
| May 26 |
58 |
29 |
554 |
146 |
| Jun 2 |
41 |
22 |
535 |
138 |
| Jun 9 |
62 |
25 |
566 |
134 |
| Jun 16 |
68 |
32 |
585 |
142 |
| Jun 23 |
65 |
26 |
612 |
142 |
| Jun 30 |
55 |
37 |
608 |
166 |
| Jul 7 |
43 |
31 |
580 |
169 |
| Jul 14 |
74 |
24 |
601 |
159 |
| Jul 21 |
71 |
37 |
607 |
159 |
| Jul 28 |
46 |
38 |
608 |
166 |
| Aug 4 |
47 |
31 |
603 |
165 |
| Aug 11 |
41 |
30 |
585 |
164 |
| Aug 18 |
55 |
24 |
587 |
152 |
| Aug 25 |
54 |
30 |
588 |
148 |
| Sep 1 |
50 |
31 |
569 |
144 |
| Sep 8 |
54 |
26 |
567 |
140 |
| Sep 15 |
39 |
37 |
561 |
143 |
| Sep 22 |
41 |
25 |
547 |
141 |
| Sep 29 |
33 |
36 |
511 |
139 |
| Oct 6 |
49 |
28 |
493 |
145 |
| Oct 13 |
54 |
27 |
501 |
145 |
| Oct 20 |
48 |
22 |
503 |
140 |
| Oct 27 |
33 |
38 |
484 |
145 |
| Nov 3 |
45 |
33 |
463 |
153 |
NSDCC List Price Quartiles
| Week |
1st Quartile |
Median List Price |
3rd Quartile |
| Jan 6 |
$2,685,000 |
$4,472,500 |
$7,995,000 |
| Jan 13 |
$2,499,000 |
$4,250,000 |
$7,750,000 |
| Jan 20 |
$2,695,000 |
$4,300,000 |
$7,767,000 |
| Jan 27 |
$2,795,000 |
$4,498,000 |
$7,995,000 |
| Feb 3 |
$2,695,000 |
$4,350,000 |
$7,499,000 |
| Feb 10 |
$2,799,000 |
$4,299,000 |
$7,695,000 |
| Feb 17 |
$2,695,000 |
$4,200,000 |
$7,750,000 |
| Feb 24 |
$2,699,500 |
$4,250,000 |
$7,645,000 |
| Mar 3 |
$2,550,000 |
$4,375,000 |
$7,497,000 |
| Mar 10 |
$2,500,000 |
$4,200,000 |
$7,250,000 |
| Mar 17 |
$2,500,000 |
$4,000,000 |
$6,995,000 |
| Mar 24 |
$2,595,000 |
$4,047,500 |
$7,275,000 |
| Mar 31 |
$2,499,000 |
$4,000,000 |
$7,300,000 |
| Apr 7 |
$2,500,000 |
$4,000,000 |
$6,995,000 |
| Apr 14 |
$2,500,000 |
$3,999,000 |
$6,995,000 |
| Apr 21 |
$2,590,000 |
$3,995,000 |
$6,799,500 |
| Apr 28 |
$2,490,000 |
$3,988,000 |
$6,500,000 |
| May 5 |
$2,395,000 |
$3,795,000 |
$6,495,000 |
| May 12 |
$2,495,000 |
$3,895,000 |
$6,500,000 |
| May 19 |
$2,495,000 |
$3,950,000 |
$6,595,000 |
| May 26 |
$2,495,000 |
$3,984,500 |
$6,547,500 |
| Jun 2 |
$2,395,000 |
$3,799,000 |
$6,295,500 |
| Jun 9 |
$2,300,000 |
$3,649,000 |
$5,998,500 |
| Jun 16 |
$2,395,000 |
$3,649,000 |
$5,999,000 |
| Jun 23 |
$2,395,000 |
$3,649,500 |
$5,999,500 |
| Jun 30 |
$2,300,000 |
$3,598,500 |
$5,999,000 |
| Jul 7 |
$2,395,000 |
$3,695,500 |
$6,100,000 |
| Jul 14 |
$2,350,000 |
$3,550,000 |
$5,999,000 |
| Jul 21 |
$2,300,000 |
$3,550,000 |
$5,995,000 |
| Jul 28 |
$2,349,000 |
$3,575,000 |
$5,995,000 |
| Aug 4 |
$2,299,949 |
$3,550,000 |
$5,995,000 |
| Aug 11 |
$2,275,000 |
$3,575,000 |
$5,995,000 |
| Aug 18 |
$2,269,000 |
$3,550,000 |
$5,995,000 |
| Aug 25 |
$2,200,000 |
$3,512,500 |
$5,950,000 |
| Sep 1 |
$2,350,000 |
$3,675,000 |
$5,995,000 |
| Sep 8 |
$2,300,000 |
$3,675,000 |
$5,995,000 |
| Sep 15 |
$2,350,000 |
$3,675,000 |
$5,995,000 |
| Sep 22 |
$2,349,000 |
$3,650,000 |
$5,995,000 |
| Sep 29 |
$2,299,999 |
$3,695,000 |
$5,995,000 |
| Oct 6 |
$2,295,000 |
$3,699,000 |
$6,150,000 |
| Oct 13 |
$2,299,999 |
$3,695,000 |
$6,150,000 |
| Oct 20 |
$2,275,000 |
$3,689,000 |
$6,000,000 |
| Oct 27 |
$2,299,999 |
$3,690,000 |
$5,998,000 |
| Nov 3 |
$2,389,000 |
$3,750,000 |
$6,150,000 |