Inventory Watch: September 1st
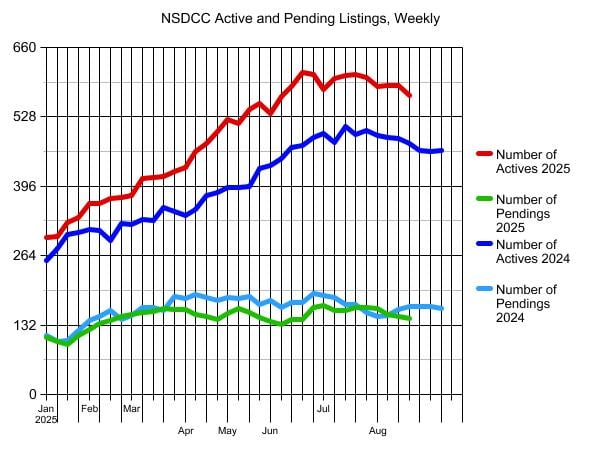
The pendings’ count has dipped well under last year now but it’s due to so many closings.
Last August there were 171 NSDCC closed sales, and this year there have already been 172 sales – and it should get up into the 190-200 range by the time every listing agent reports their sales over the next week or two.
August 2024 median sales price: $2,287,500.
August 2025 median sales price: $2,500,000 or +9%!
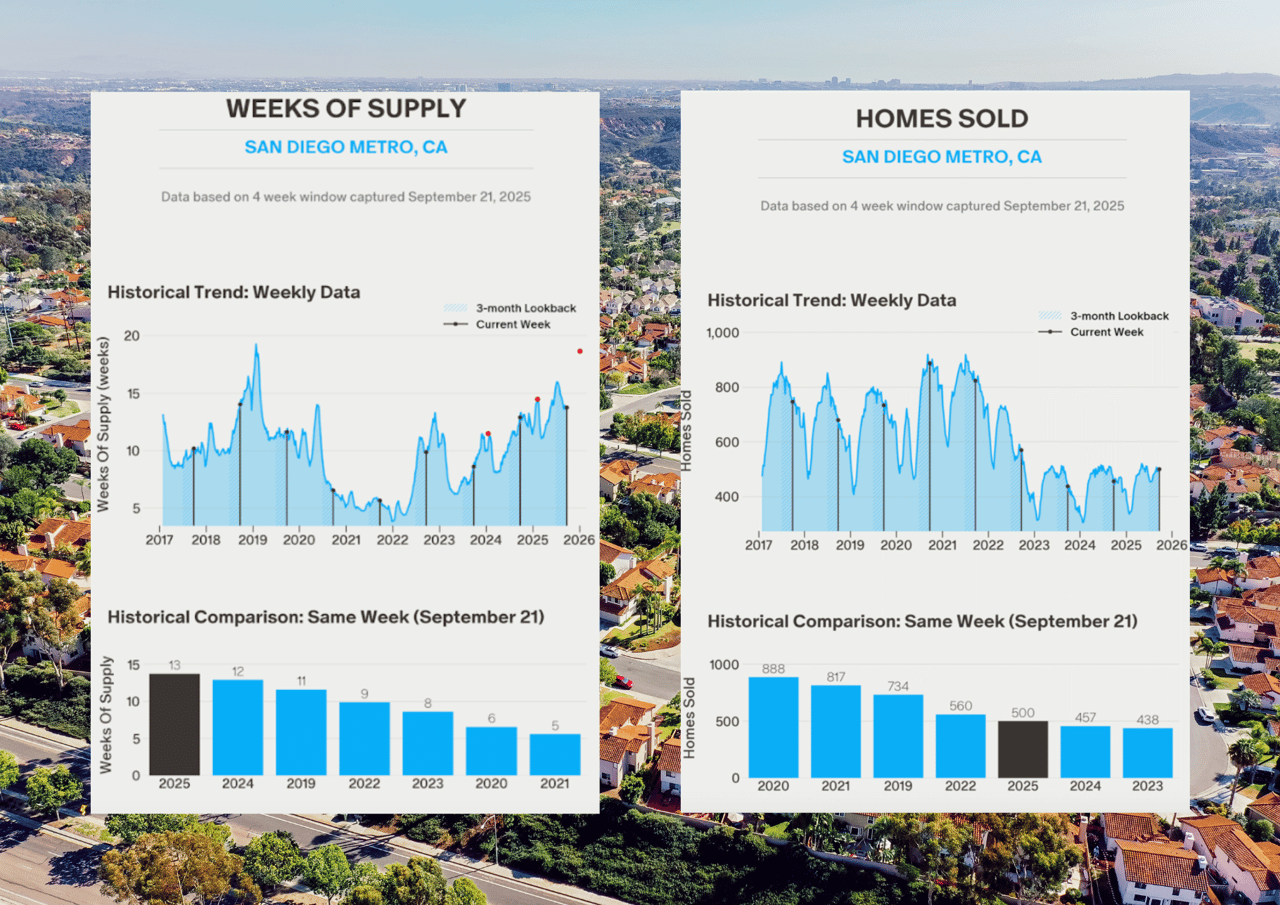
Here is how this week compared to the same week last year. Today’s unsold sellers shouldn’t feel too bad about having to sharpen their pencil if they’ve gone a few months without selling because you’re not giving it away – pricing is higher today:

The $0 – $2,000,000 Market:
| Date |
NSDCC Active Listings |
Avg. LP/sf |
Avg. DOM |
# of Pendings |
| Jan 6, 2025 |
43 |
$918/sf |
63 |
27 |
| Jan 13 |
45 |
$936/sf |
53 |
22 |
| Jan 20 |
47 |
$908/sf |
54 |
25 |
| Jan 27 |
48 |
$904/sf |
48 |
32 |
| Feb 3 |
51 |
$914/sf |
47 |
41 |
| Feb 10 |
45 |
$935/sf |
46 |
45 |
| Feb 17 |
45 |
$916/sf |
46 |
46 |
| Feb 24 |
45 |
$958/sf |
48 |
40 |
| Mar 3 |
50 |
$950/sf |
37 |
42 |
| Mar 10 |
55 |
$908/sf |
36 |
45 |
| Mar 17 |
53 |
$891/sf |
35 |
50 |
| Mar 24 |
53 |
$898/sf |
30 |
51 |
| Mar 31 |
58 |
$878/sf |
35 |
44 |
| Apr 7 |
56 |
$867/sf |
30 |
43 |
| Apr 14 |
63 |
$906/sf |
32 |
40 |
| Apr 21 |
59 |
$936/sf |
35 |
37 |
| Apr 28 |
74 |
$899/sf |
32 |
39 |
| May 5 |
83 |
$907/sf |
30 |
47 |
| May 12 |
72 |
$916/sf |
34 |
44 |
| May 19 |
70 |
$898/sf |
38 |
51 |
| May 26 |
74 |
$923/sf |
39 |
43 |
| Jun 2 |
76 |
$912/sf |
39 |
36 |
| Jun 9 |
87 |
$939/sf |
38 |
36 |
| Jun 16 |
83 |
$922/sf |
41 |
48 |
| Jun 23 |
89 |
$930/sf |
46 |
52 |
| Jun 30 |
96 |
$938/sf |
42 |
57 |
| Jul 7 |
83 |
$944/sf |
45 |
63 |
| Jul 14 |
94 |
$910/sf |
47 |
53 |
| Jul 21 |
104 |
$897/sf |
45 |
49 |
| Jul 28 |
102 |
$882/sf |
48 |
51 |
| Aug 4 |
106 |
$858/sf |
50 |
47 |
| Aug 11 |
107 |
$864/sf |
50 |
44 |
| Aug 18 |
110 |
$836/sf |
51 |
42 |
| Aug 25 |
115 |
$843/sf |
47 |
49 |
| Sep 1 |
101 |
$832/sf |
52 |
49 |
The $2,000,000 – $3,000,000 Market:
| Date |
NSDCC Active Listings |
Avg. LP/sf |
Avg. DOM |
# of Pendings |
| Jan 6, 2025 |
55 |
$1,029/sf |
66 |
36 |
| Jan 13 |
58 |
$990/sf |
63 |
31 |
| Jan 20 |
64 |
$1,018/sf |
57 |
26 |
| Jan 27 |
64 |
$1,025/sf |
53 |
31 |
| Feb 3 |
71 |
$1,009/sf |
50 |
31 |
| Feb 10 |
75 |
$1,005/sf |
46 |
36 |
| Feb 17 |
81 |
$1,015/sf |
44 |
39 |
| Feb 24 |
80 |
$1,012/sf |
38 |
52 |
| Mar 3 |
80 |
$1,034/sf |
33 |
49 |
| Mar 10 |
92 |
$1,029/sf |
37 |
44 |
| Mar 17 |
98 |
$1,015/sf |
39 |
44 |
| Mar 24 |
98 |
$1,008/sf |
41 |
52 |
| Mar 31 |
100 |
$997/sf |
44 |
54 |
| Apr 7 |
94 |
$940/sf |
43 |
54 |
| Apr 14 |
96 |
$962/sf |
42 |
53 |
| Apr 21 |
107 |
$1,000/sf |
43 |
53 |
| Apr 28 |
109 |
$1,010/sf |
44 |
49 |
| May 5 |
124 |
$1,036/sf |
40 |
50 |
| May 12 |
120 |
$1,041/sf |
43 |
57 |
| May 19 |
133 |
$1,034/sf |
43 |
49 |
| May 26 |
133 |
$1,055/sf |
47 |
53 |
| Jun 2 |
140 |
$1,039/sf |
48 |
51 |
| Jun 9 |
149 |
$1,042/sf |
45 |
45 |
| Jun 16 |
157 |
$1,043/sf |
46 |
44 |
| Jun 23 |
163 |
$1,028/sf |
45 |
43 |
| Jun 30 |
156 |
$1,030/sf |
45 |
46 |
| Jul 7 |
144 |
$1,048/sf |
47 |
46 |
| Jul 14 |
156 |
$1,023/sf |
46 |
45 |
| Jul 21 |
154 |
$1,018/sf |
45 |
54 |
| Jul 28 |
149 |
$1,021/sf |
50 |
56 |
| Aug 4 |
144 |
$1,031/sf |
48 |
60 |
| Aug 11 |
133 |
$1,054/sf |
58 |
62 |
| Aug 18 |
133 |
$1,046/sf |
57 |
54 |
| Aug 25 |
131 |
$1,020/sf |
58 |
46 |
| Sep 1 |
123 |
$1,060/sf |
58 |
44 |
The $3,000,000 – $4,000,000 Market:
| Date |
NSDCC Active Listings |
Avg. LP/sf |
Avg. DOM |
# of Pendings |
| Jan 6, 2025 |
44 |
$1,091/sf |
82 |
19 |
| Jan 13 |
46 |
$1,122/sf |
77 |
19 |
| Jan 20 |
52 |
$1,156/sf |
70 |
16 |
| Jan 27 |
49 |
$1,197/sf |
67 |
20 |
| Feb 3 |
56 |
$1,182/sf |
55 |
21 |
| Feb 10 |
58 |
$1,158/sf |
51 |
25 |
| Feb 17 |
58 |
$1,179/sf |
54 |
24 |
| Feb 24 |
56 |
$1,168/sf |
52 |
24 |
| Mar 3 |
51 |
$1,147/sf |
56 |
31 |
| Mar 10 |
56 |
$1,240/sf |
61 |
34 |
| Mar 17 |
60 |
$1,209/sf |
61 |
36 |
| Mar 24 |
60 |
$1,209/sf |
62 |
39 |
| Mar 31 |
62 |
$1,158/sf |
64 |
34 |
| Apr 7 |
68 |
$1,208/sf |
59 |
34 |
| Apr 14 |
79 |
$1,193/sf |
55 |
26 |
| Apr 21 |
85 |
$1,230/sf |
54 |
28 |
| Apr 28 |
85 |
$1,198/sf |
53 |
28 |
| May 5 |
82 |
$1,179/sf |
56 |
28 |
| May 12 |
89 |
$1,148/sf |
53 |
30 |
| May 19 |
88 |
$1,161/sf |
56 |
28 |
| May 26 |
85 |
$1,157/sf |
58 |
26 |
| Jun 2 |
81 |
$1,162/sf |
58 |
22 |
| Jun 9 |
89 |
$1,146/sf |
58 |
21 |
| Jun 16 |
95 |
$1,107/sf |
56 |
17 |
| Jun 23 |
101 |
$1,146/sf |
58 |
18 |
| Jun 30 |
102 |
$1,192/sf |
56 |
24 |
| Jul 7 |
102 |
$1,176/sf |
55 |
21 |
| Jul 14 |
108 |
$1,174/sf |
55 |
20 |
| Jul 21 |
105 |
$1,212/sf |
57 |
17 |
| Jul 28 |
114 |
$1,211/sf |
55 |
16 |
| Aug 4 |
111 |
$1,221/sf |
56 |
15 |
| Aug 11 |
105 |
$1,277/sf |
58 |
19 |
| Aug 18 |
104 |
$1,271/sf |
57 |
17 |
| Aug 25 |
101 |
$1,284/sf |
61 |
18 |
| Sep 1 |
101 |
$1,285/sf |
66 |
17 |
The $4,000,000+ Market:
| Date |
NSDCC Active Listings |
Avg. LP/sf |
Avg. DOM |
# of Pendings |
| Jan 6, 2025 |
160 |
$1,822/sf |
105 |
27 |
| Jan 13 |
156 |
$1,868/sf |
105 |
31 |
| Jan 20 |
170 |
$1,936/sf |
95 |
29 |
| Jan 27 |
180 |
$1,877/sf |
90 |
31 |
| Feb 3 |
189 |
$1,884/sf |
85 |
31 |
| Feb 10 |
189 |
$1,864/sf |
88 |
29 |
| Feb 17 |
192 |
$1,875/sf |
90 |
32 |
| Feb 24 |
195 |
$1,869/sf |
91 |
34 |
| Mar 3 |
200 |
$1,860/sf |
87 |
34 |
| Mar 10 |
213 |
$1,811/sf |
83 |
36 |
| Mar 17 |
208 |
$1,755/sf |
85 |
30 |
| Mar 24 |
211 |
$1,800/sf |
86 |
25 |
| Mar 31 |
213 |
$1,784/sf |
90 |
32 |
| Apr 7 |
219 |
$1,777/sf |
90 |
33 |
| Apr 14 |
230 |
$1,790/sf |
87 |
35 |
| Apr 21 |
231 |
$1,792/sf |
87 |
32 |
| Apr 28 |
235 |
$1,772/sf |
88 |
28 |
| May 5 |
239 |
$1,811/sf |
82 |
30 |
| May 12 |
239 |
$1,811/sf |
85 |
33 |
| May 19 |
255 |
$1,773/sf |
85 |
29 |
| May 26 |
265 |
$1,759/sf |
87 |
24 |
| Jun 2 |
242 |
$1,745/sf |
90 |
29 |
| Jun 9 |
244 |
$1,774/sf |
90 |
33 |
| Jun 16 |
254 |
$1,766/sf |
88 |
34 |
| Jun 23 |
265 |
$1,787/sf |
91 |
30 |
| Jun 30 |
260 |
$1,786/sf |
92 |
40 |
| Jul 7 |
257 |
$1,720/sf |
95 |
41 |
| Jul 14 |
250 |
$1,749/sf |
101 |
45 |
| Jul 21 |
249 |
$1,738/sf |
102 |
44 |
| Jul 28 |
249 |
$1,731/sf |
104 |
47 |
| Aug 4 |
245 |
$1,748/sf |
106 |
46 |
| Aug 11 |
243 |
$1,758/sf |
109 |
41 |
| Aug 18 |
244 |
$1,738/sf |
110 |
40 |
| Aug 25 |
244 |
$1,745/sf |
112 |
36 |
| Sep 1 |
247 |
$1,759/sf |
111 |
35 |
NSDCC Weekly New Listings and New Pendings
| Week |
New Listings |
New Pendings |
Total Actives |
Total Pendings |
| Jan 6 |
27 |
11 |
298 |
108 |
| Jan 13 |
38 |
26 |
301 |
101 |
| Jan 20 |
55 |
16 |
328 |
95 |
| Jan 27 |
60 |
32 |
337 |
113 |
| Feb 3 |
72 |
28 |
363 |
123 |
| Feb 10 |
50 |
34 |
364 |
135 |
| Feb 17 |
50 |
29 |
373 |
140 |
| Feb 24 |
58 |
38 |
374 |
148 |
| Mar 3 |
60 |
31 |
378 |
152 |
| Mar 10 |
60 |
30 |
411 |
156 |
| Mar 17 |
49 |
37 |
413 |
157 |
| Mar 24 |
57 |
39 |
414 |
164 |
| Mar 31 |
47 |
27 |
425 |
162 |
| Apr 7 |
52 |
31 |
431 |
162 |
| Apr 14 |
70 |
28 |
462 |
153 |
| Apr 21 |
58 |
24 |
478 |
148 |
| Apr 28 |
71 |
30 |
501 |
143 |
| May 5 |
82 |
37 |
524 |
154 |
| May 12 |
56 |
39 |
516 |
163 |
| May 19 |
54 |
20 |
543 |
156 |
| May 26 |
58 |
29 |
554 |
146 |
| Jun 2 |
41 |
22 |
535 |
138 |
| Jun 9 |
62 |
25 |
566 |
134 |
| Jun 16 |
68 |
32 |
585 |
142 |
| Jun 23 |
65 |
26 |
612 |
142 |
| Jun 30 |
55 |
37 |
608 |
166 |
| Jul 7 |
43 |
31 |
580 |
169 |
| Jul 14 |
74 |
24 |
601 |
159 |
| Jul 21 |
71 |
37 |
607 |
159 |
| Jul 28 |
46 |
38 |
608 |
166 |
| Aug 4 |
47 |
31 |
603 |
165 |
| Aug 11 |
41 |
30 |
585 |
164 |
| Aug 18 |
55 |
24 |
587 |
152 |
| Aug 25 |
54 |
30 |
588 |
148 |
| Sep 1 |
50 |
31 |
569 |
144 |
NSDCC List Price Quartiles
| Week |
1st Quartile |
Median List Price |
3rd Quartile |
| Jan 6 |
$2,685,000 |
$4,472,500 |
$7,995,000 |
| Jan 13 |
$2,499,000 |
$4,250,000 |
$7,750,000 |
| Jan 20 |
$2,695,000 |
$4,300,000 |
$7,767,000 |
| Jan 27 |
$2,795,000 |
$4,498,000 |
$7,995,000 |
| Feb 3 |
$2,695,000 |
$4,350,000 |
$7,499,000 |
| Feb 10 |
$2,799,000 |
$4,299,000 |
$7,695,000 |
| Feb 17 |
$2,695,000 |
$4,200,000 |
$7,750,000 |
| Feb 24 |
$2,699,500 |
$4,250,000 |
$7,645,000 |
| Mar 3 |
$2,550,000 |
$4,375,000 |
$7,497,000 |
| Mar 10 |
$2,500,000 |
$4,200,000 |
$7,250,000 |
| Mar 17 |
$2,500,000 |
$4,000,000 |
$6,995,000 |
| Mar 24 |
$2,595,000 |
$4,047,500 |
$7,275,000 |
| Mar 31 |
$2,499,000 |
$4,000,000 |
$7,300,000 |
| Apr 7 |
$2,500,000 |
$4,000,000 |
$6,995,000 |
| Apr 14 |
$2,500,000 |
$3,999,000 |
$6,995,000 |
| Apr 21 |
$2,590,000 |
$3,995,000 |
$6,799,500 |
| Apr 28 |
$2,490,000 |
$3,988,000 |
$6,500,000 |
| May 5 |
$2,395,000 |
$3,795,000 |
$6,495,000 |
| May 12 |
$2,495,000 |
$3,895,000 |
$6,500,000 |
| May 19 |
$2,495,000 |
$3,950,000 |
$6,595,000 |
| May 26 |
$2,495,000 |
$3,984,500 |
$6,547,500 |
| Jun 2 |
$2,395,000 |
$3,799,000 |
$6,295,500 |
| Jun 9 |
$2,300,000 |
$3,649,000 |
$5,998,500 |
| Jun 16 |
$2,395,000 |
$3,649,000 |
$5,999,000 |
| Jun 23 |
$2,395,000 |
$3,649,500 |
$5,999,500 |
| Jun 30 |
$2,300,000 |
$3,598,500 |
$5,999,000 |
| Jul 7 |
$2,395,000 |
$3,695,500 |
$6,100,000 |
| Jul 14 |
$2,350,000 |
$3,550,000 |
$5,999,000 |
| Jul 21 |
$2,300,000 |
$3,550,000 |
$5,995,000 |
| Jul 28 |
$2,349,000 |
$3,575,000 |
$5,995,000 |
| Aug 4 |
$2,299,949 |
$3,550,000 |
$5,995,000 |
| Aug 11 |
$2,275,000 |
$3,575,000 |
$5,995,000 |
| Aug 18 |
$2,269,000 |
$3,550,000 |
$5,995,000 |
| Aug 25 |
$2,200,000 |
$3,512,500 |
$5,950,000 |
| Sep 1 |
$2,350,000 |
$3,675,000 |
$5,995,000 |