Inventory Watch: March 3rd

The surge of active listings in January got a boost from last year’s unsolds coming right back on the market. Since then, the flow has moderated and looks somewhat sustainable if it stays at this pace.
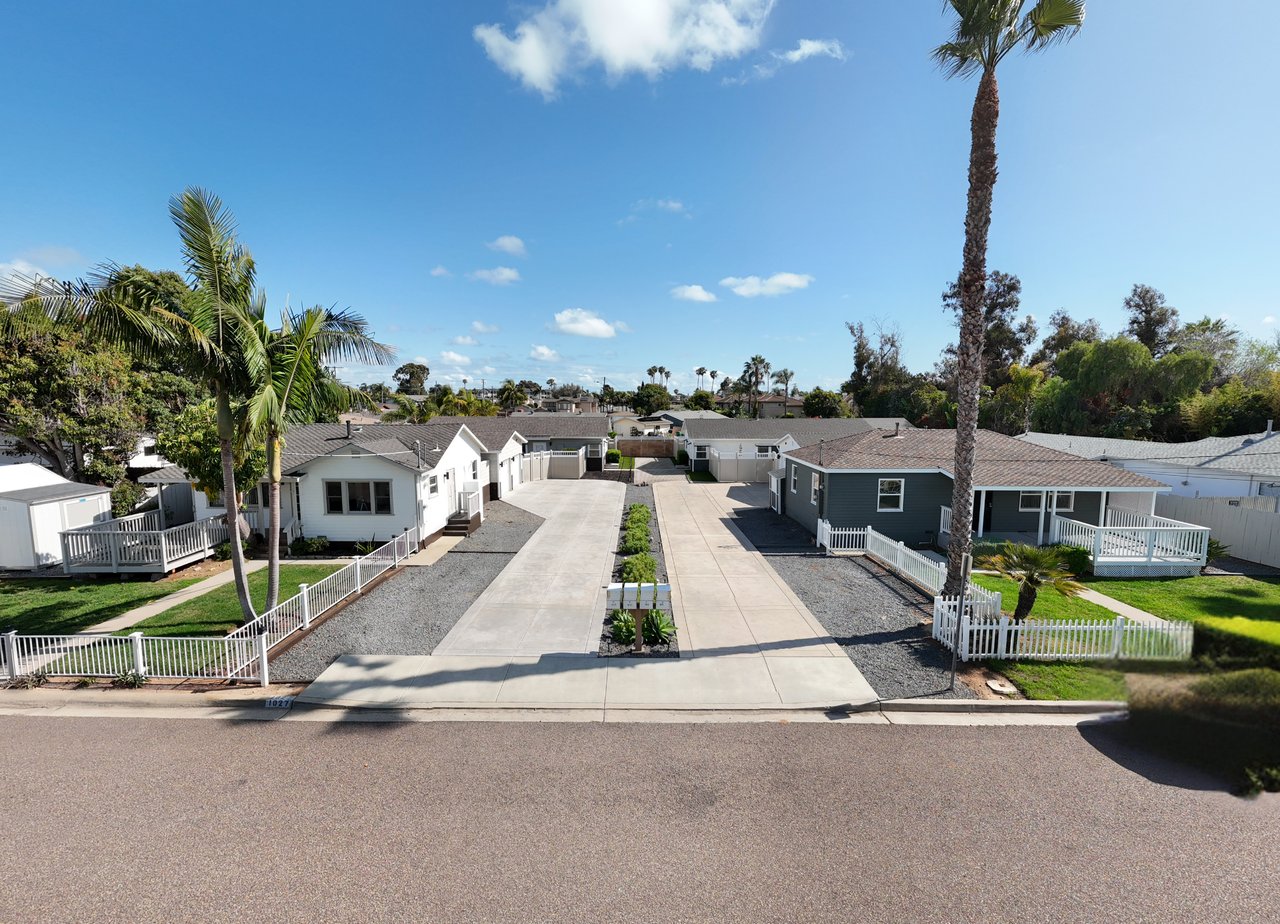
It’s fairly easy to describe the NSDCC market today. The lower-end is warm/hot, and the higher-end is not:
 :
:
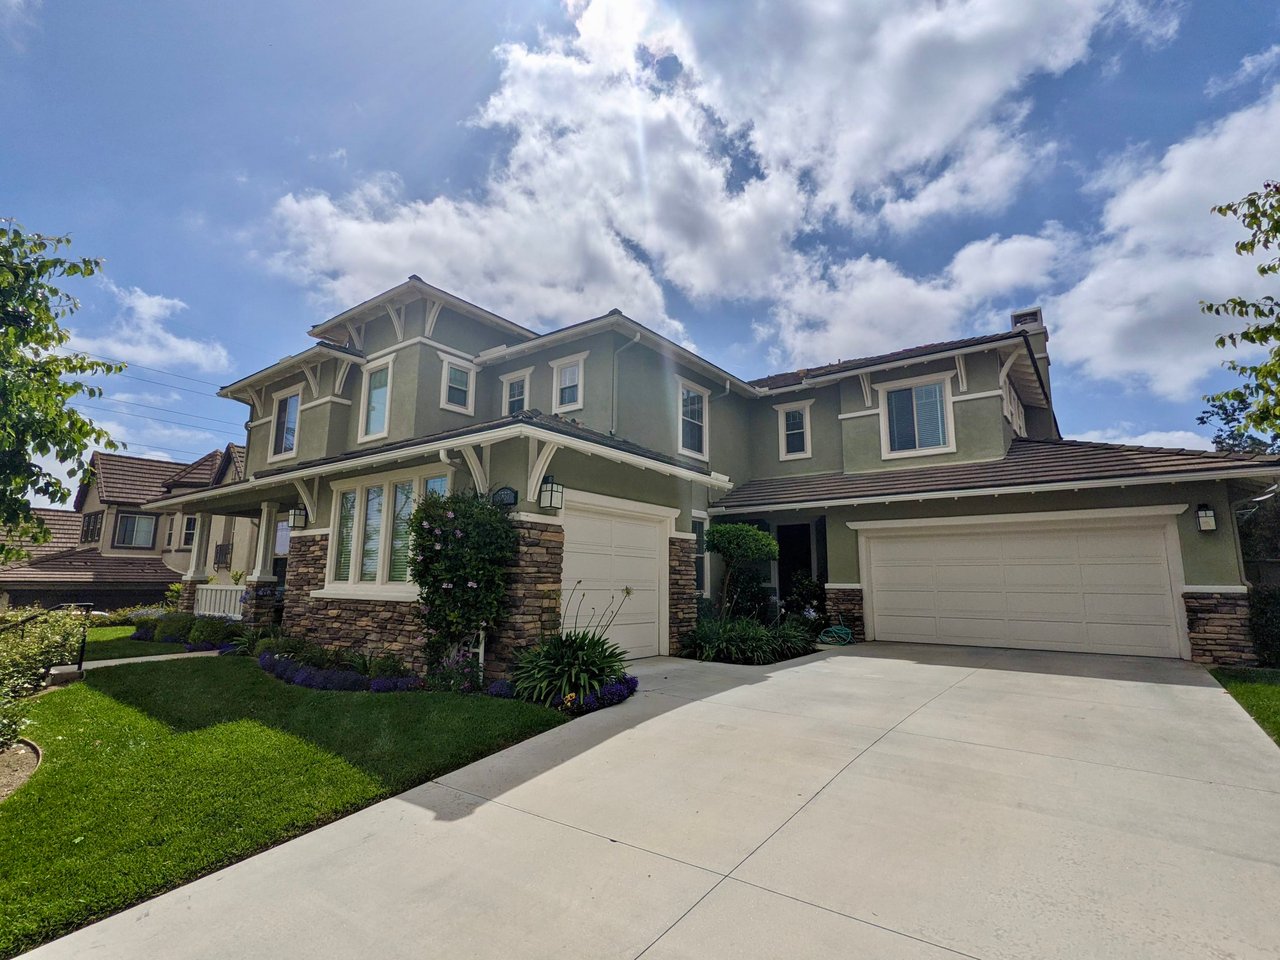
The higher-end crowd (sellers and agents) want to believe that it just takes longer to sell these days, and they are content to wait it out. After all, they aren’t going to give it away!
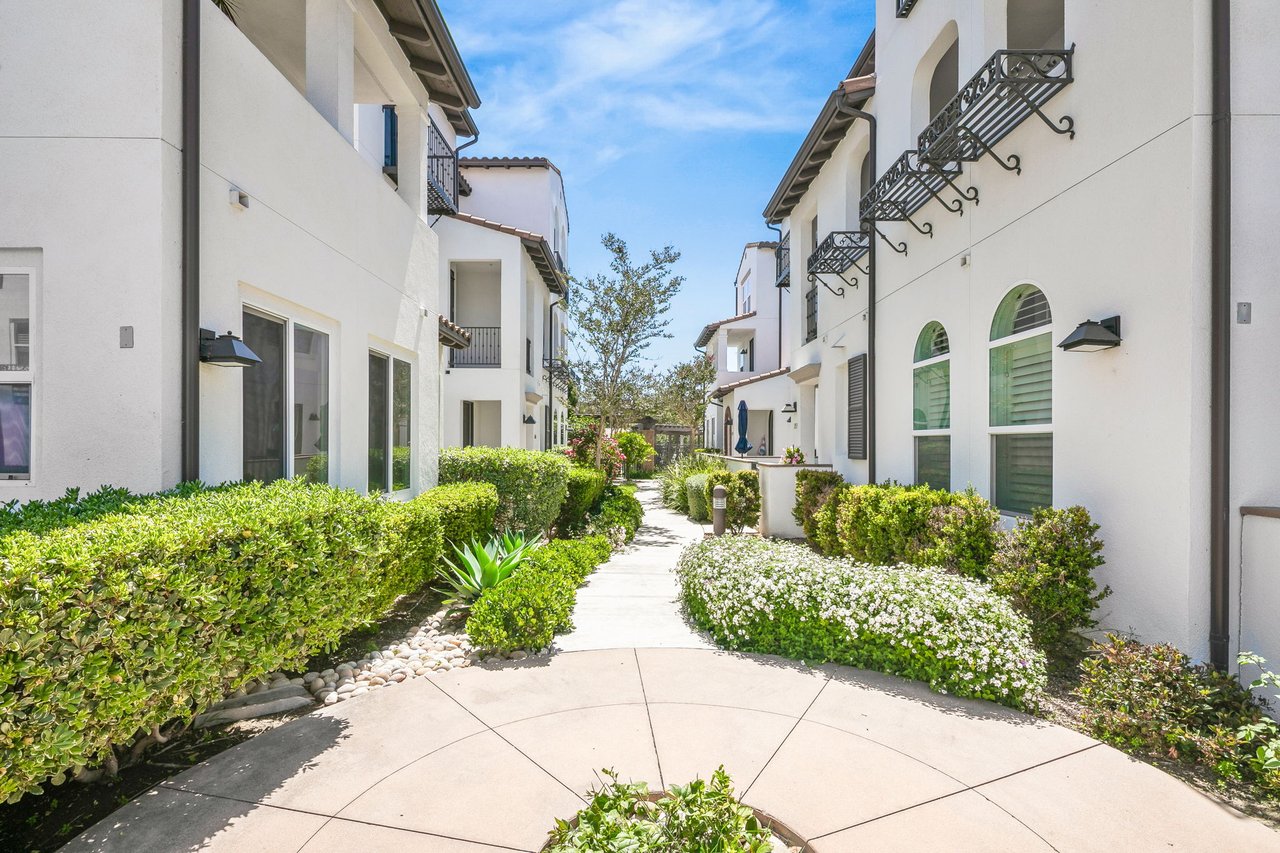
It seems like there are enough sales happening under $4,000,000 that buyers aren’t being dangerously affected by more homes on the market. If there was going to be some reaction to additional inventory, you’d think it would be in the more-sensitive Under-$4M buyers.
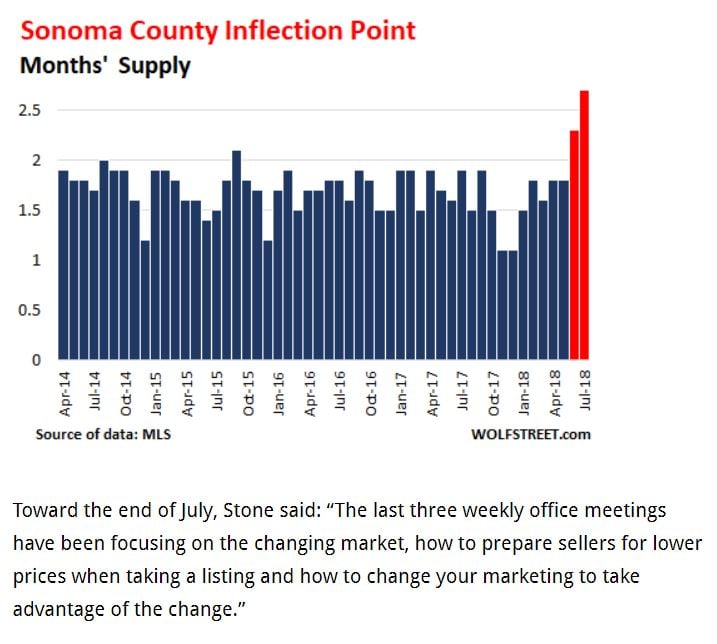
My prediction of 15% to 20% more inventory hasn’t come true…..yet:

Maybe help is on the way?


The $0 – $2,000,000 Market:
| Date | ||||
| Jan 6, 2025 | ||||
| Jan 13 | ||||
| Jan 20 | ||||
| Jan 27 | ||||
| Feb 3 | ||||
| Feb 10 | ||||
| Feb 17 | ||||
| Feb 24 | ||||
| Mar 3 |
The $2,000,000 – $3,000,000 Market:
| Date | ||||
| Jan 6, 2025 | ||||
| Jan 13 | ||||
| Jan 20 | ||||
| Jan 27 | ||||
| Feb 3 | ||||
| Feb 10 | ||||
| Feb 17 | ||||
| Feb 24 | ||||
| Mar 3 |
The $3,000,000 – $4,000,000 Market:
| Date | ||||
| Jan 6, 2025 | ||||
| Jan 13 | ||||
| Jan 20 | ||||
| Jan 27 | ||||
| Feb 3 | ||||
| Feb 10 | ||||
| Feb 17 | ||||
| Feb 24 | ||||
| Mar 3 |
The $4,000,000+ Market:
| Date | ||||
| Jan 6, 2025 | ||||
| Jan 13 | ||||
| Jan 20 | ||||
| Jan 27 | ||||
| Feb 3 | ||||
| Feb 10 | ||||
| Feb 17 | ||||
| Feb 24 | ||||
| Mar 3 |
NSDCC Weekly New Listings and New Pendings
| Week | ||||
| Jan 6 | ||||
| Jan 13 | ||||
| Jan 20 | ||||
| Jan 27 | ||||
| Feb 3 | ||||
| Feb 10 | ||||
| Feb 17 | ||||
| Feb 24 | ||||
| Mar 3 |
NSDCC List Price Quartiles
| Week | |||
| Jan 6 | |||
| Jan 13 | |||
| Jan 20 | |||
| Jan 27 | |||
| Feb 3 | |||
| Feb 10 | |||
| Feb 17 | |||
| Feb 24 | |||
| Mar 3 |