
Inventory Watch: February 3rd

My predicted surge in inventory is underway – look at the navy-blue line above. There are 363 active listings between La Jolla and Carlsbad today, and once the Super Bowl is out of the way, we should really get rocking. It should easily reach 400 before the end of the month.
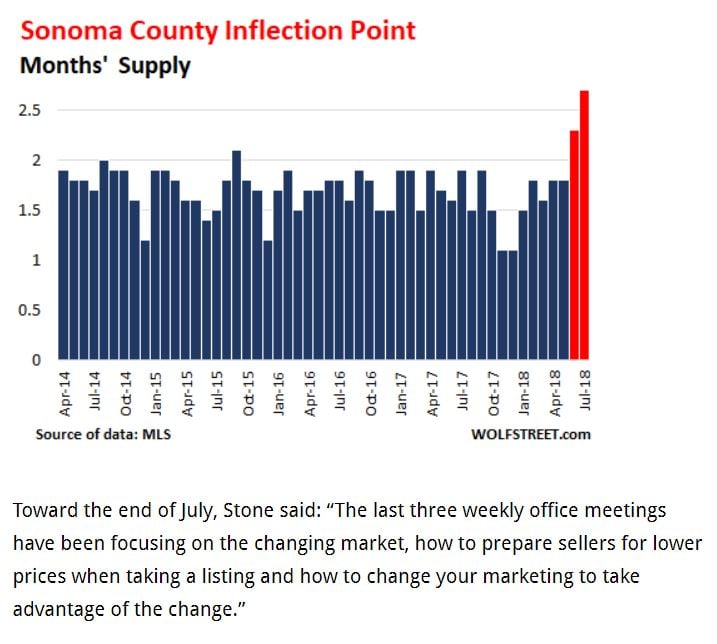
It’s not a bad thing for the sellers who are willing to price attractively – there is still plenty of action. There will just be more this year that don’t sell at all.
NSDCC New Listings In The Last Week: 72 (+8%)
NSDCC New Pendings In The Last Week: 28 (+9%)
Buyers love the additional choices and will continue to be very picky, especially on price.
How did last month measure up?
NSDCC January Sales: 117 (102 last January)
NSDCC January Listings: 243 (242 last January)
Both of those categories should swell by roughly 10% as the late-reporters log in.
The final guesses on the number of NSDCC January listings:
211 – Eddie89
213 – Shadash
216 – regina
246 – Anne M
267 – Surfrider
280 – doughboy
293 – Joe
296 – Tim DeRoche
303 – Tom
307 – Jun
311 – SN
317 – CB Mark
318 – Nick
328 – Majeed
337 – natalie
353 – Derek
355 – Skip
365 – Leo
401 – Dr k
417 – Susie
421 – Giving Cat
Giving Cat (Rob Dawg) will probably endure the same fate as with the Coffee Bet – being correct, just early.
In April, 2009, real estate bloggers did a panel discussion on when the bottom would be, and I guessed December, 2011. Instead, the bottom happened during the very month of our discussion – April, 2009! https://www.bubbleinfo.com/2009/04/24/coffee-bet-2/
Check those lively comment sections too!
The $0 – $2,000,000 Market:
| Date | ||||
| Jan 6, 2025 | ||||
| Jan 13 | ||||
| Jan 20 | ||||
| Jan 27 | ||||
| Feb 3 |
The $2,000,000 – $3,000,000 Market:
| Date | ||||
| Jan 6, 2025 | ||||
| Jan 13 | ||||
| Jan 20 | ||||
| Jan 27 | ||||
| Feb 3 |
The $3,000,000 – $4,000,000 Market:
| Date | ||||
| Jan 6, 2025 | ||||
| Jan 13 | ||||
| Jan 20 | ||||
| Jan 27 | ||||
| Feb 3 |
The $4,000,000+ Market:
| Date | ||||
| Jan 6, 2025 | ||||
| Jan 13 | ||||
| Jan 20 | ||||
| Jan 27 | ||||
| Feb 3 |
NSDCC Weekly New Listings and New Pendings
| Week | ||||
| Jan 6 | ||||
| Jan 13 | ||||
| Jan 20 | ||||
| Jan 27 | ||||
| Feb 3 |
NSDCC List Price Quartiles
| Week | |||
| Jan 6 | |||
| Jan 13 | |||
| Jan 20 | |||
| Jan 27 | |||
| Feb 3 |