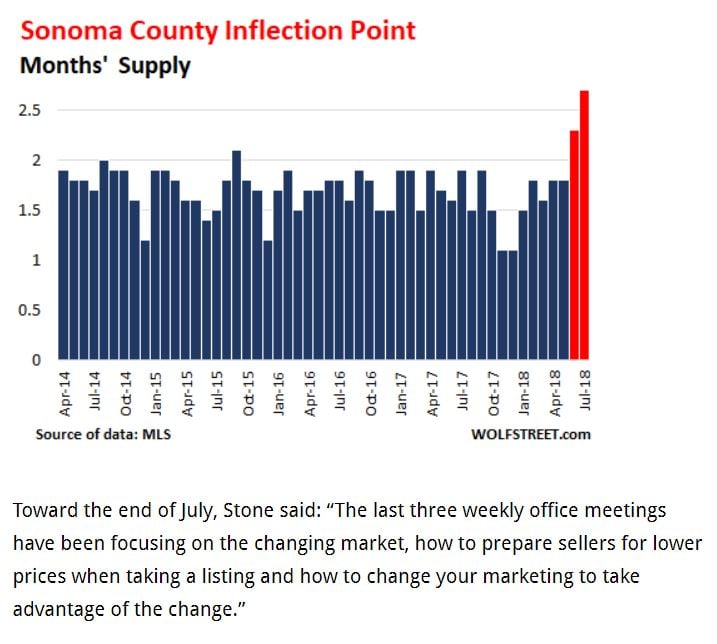
Inventory Watch: August 4th
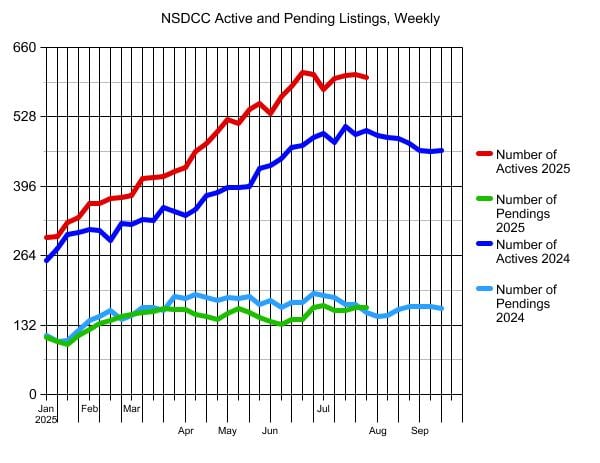
After months of chaos and no relief from high mortgage rates, how many of us thought the pendings count would be higher today – in August – than it was at this time last year?
Maybe it’s a delayed response after Liberation Day caused the dip in April?
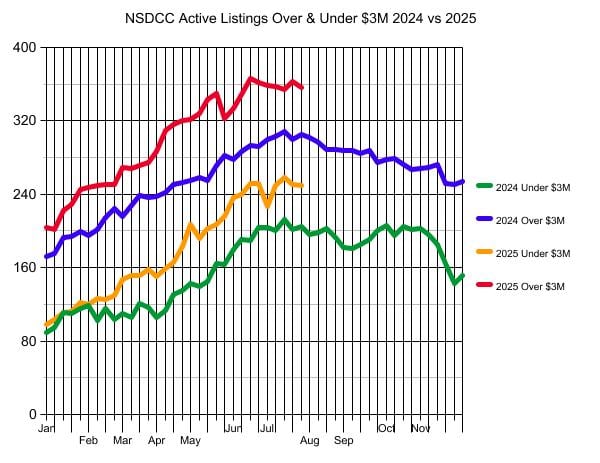
The increase in the active listings is still spread across all price points too:
There are plenty of choices and rates might get a little better. Are we due for a mini-rally over the next few weeks before the fourth quarter deep freeze arrives?
The $0 – $2,000,000 Market:
| Date |
NSDCC Active Listings |
Avg. LP/sf |
Avg. DOM |
# of Pendings |
| Jan 6, 2025 |
43 |
$918/sf |
63 |
27 |
| Jan 13 |
45 |
$936/sf |
53 |
22 |
| Jan 20 |
47 |
$908/sf |
54 |
25 |
| Jan 27 |
48 |
$904/sf |
48 |
32 |
| Feb 3 |
51 |
$914/sf |
47 |
41 |
| Feb 10 |
45 |
$935/sf |
46 |
45 |
| Feb 17 |
45 |
$916/sf |
46 |
46 |
| Feb 24 |
45 |
$958/sf |
48 |
40 |
| Mar 3 |
50 |
$950/sf |
37 |
42 |
| Mar 10 |
55 |
$908/sf |
36 |
45 |
| Mar 17 |
53 |
$891/sf |
35 |
50 |
| Mar 24 |
53 |
$898/sf |
30 |
51 |
| Mar 31 |
58 |
$878/sf |
35 |
44 |
| Apr 7 |
56 |
$867/sf |
30 |
43 |
| Apr 14 |
63 |
$906/sf |
32 |
40 |
| Apr 21 |
59 |
$936/sf |
35 |
37 |
| Apr 28 |
74 |
$899/sf |
32 |
39 |
| May 5 |
83 |
$907/sf |
30 |
47 |
| May 12 |
72 |
$916/sf |
34 |
44 |
| May 19 |
70 |
$898/sf |
38 |
51 |
| May 26 |
74 |
$923/sf |
39 |
43 |
| Jun 2 |
76 |
$912/sf |
39 |
36 |
| Jun 9 |
87 |
$939/sf |
38 |
36 |
| Jun 16 |
83 |
$922/sf |
41 |
48 |
| Jun 23 |
89 |
$930/sf |
46 |
52 |
| Jun 30 |
96 |
$938/sf |
42 |
57 |
| Jul 7 |
83 |
$944/sf |
45 |
63 |
| Jul 14 |
94 |
$910/sf |
47 |
53 |
| Jul 21 |
104 |
$897/sf |
45 |
49 |
| Jul 28 |
102 |
$882/sf |
48 |
51 |
| Aug 4 |
106 |
$858/sf |
50 |
47 |
The $2,000,000 – $3,000,000 Market:
| Date |
NSDCC Active Listings |
Avg. LP/sf |
Avg. DOM |
# of Pendings |
| Jan 6, 2025 |
55 |
$1,029/sf |
66 |
36 |
| Jan 13 |
58 |
$990/sf |
63 |
31 |
| Jan 20 |
64 |
$1,018/sf |
57 |
26 |
| Jan 27 |
64 |
$1,025/sf |
53 |
31 |
| Feb 3 |
71 |
$1,009/sf |
50 |
31 |
| Feb 10 |
75 |
$1,005/sf |
46 |
36 |
| Feb 17 |
81 |
$1,015/sf |
44 |
39 |
| Feb 24 |
80 |
$1,012/sf |
38 |
52 |
| Mar 3 |
80 |
$1,034/sf |
33 |
49 |
| Mar 10 |
92 |
$1,029/sf |
37 |
44 |
| Mar 17 |
98 |
$1,015/sf |
39 |
44 |
| Mar 24 |
98 |
$1,008/sf |
41 |
52 |
| Mar 31 |
100 |
$997/sf |
44 |
54 |
| Apr 7 |
94 |
$940/sf |
43 |
54 |
| Apr 14 |
96 |
$962/sf |
42 |
53 |
| Apr 21 |
107 |
$1,000/sf |
43 |
53 |
| Apr 28 |
109 |
$1,010/sf |
44 |
49 |
| May 5 |
124 |
$1,036/sf |
40 |
50 |
| May 12 |
120 |
$1,041/sf |
43 |
57 |
| May 19 |
133 |
$1,034/sf |
43 |
49 |
| May 26 |
133 |
$1,055/sf |
47 |
53 |
| Jun 2 |
140 |
$1,039/sf |
48 |
51 |
| Jun 9 |
149 |
$1,042/sf |
45 |
45 |
| Jun 16 |
157 |
$1,043/sf |
46 |
44 |
| Jun 23 |
163 |
$1,028/sf |
45 |
43 |
| Jun 30 |
156 |
$1,030/sf |
45 |
46 |
| Jul 7 |
144 |
$1,048/sf |
47 |
46 |
| Jul 14 |
156 |
$1,023/sf |
46 |
45 |
| Jul 21 |
154 |
$1,018/sf |
45 |
54 |
| Jul 28 |
149 |
$1,021/sf |
50 |
56 |
| Aug 4 |
144 |
$1,031/sf |
48 |
60 |
The $3,000,000 – $4,000,000 Market:
| Date |
NSDCC Active Listings |
Avg. LP/sf |
Avg. DOM |
# of Pendings |
| Jan 6, 2025 |
44 |
$1,091/sf |
82 |
19 |
| Jan 13 |
46 |
$1,122/sf |
77 |
19 |
| Jan 20 |
52 |
$1,156/sf |
70 |
16 |
| Jan 27 |
49 |
$1,197/sf |
67 |
20 |
| Feb 3 |
56 |
$1,182/sf |
55 |
21 |
| Feb 10 |
58 |
$1,158/sf |
51 |
25 |
| Feb 17 |
58 |
$1,179/sf |
54 |
24 |
| Feb 24 |
56 |
$1,168/sf |
52 |
24 |
| Mar 3 |
51 |
$1,147/sf |
56 |
31 |
| Mar 10 |
56 |
$1,240/sf |
61 |
34 |
| Mar 17 |
60 |
$1,209/sf |
61 |
36 |
| Mar 24 |
60 |
$1,209/sf |
62 |
39 |
| Mar 31 |
62 |
$1,158/sf |
64 |
34 |
| Apr 7 |
68 |
$1,208/sf |
59 |
34 |
| Apr 14 |
79 |
$1,193/sf |
55 |
26 |
| Apr 21 |
85 |
$1,230/sf |
54 |
28 |
| Apr 28 |
85 |
$1,198/sf |
53 |
28 |
| May 5 |
82 |
$1,179/sf |
56 |
28 |
| May 12 |
89 |
$1,148/sf |
53 |
30 |
| May 19 |
88 |
$1,161/sf |
56 |
28 |
| May 26 |
85 |
$1,157/sf |
58 |
26 |
| Jun 2 |
81 |
$1,162/sf |
58 |
22 |
| Jun 9 |
89 |
$1,146/sf |
58 |
21 |
| Jun 16 |
95 |
$1,107/sf |
56 |
17 |
| Jun 23 |
101 |
$1,146/sf |
58 |
18 |
| Jun 30 |
102 |
$1,192/sf |
56 |
24 |
| Jul 7 |
102 |
$1,176/sf |
55 |
21 |
| Jul 14 |
108 |
$1,174/sf |
55 |
20 |
| Jul 21 |
105 |
$1,212/sf |
57 |
17 |
| Jul 28 |
114 |
$1,211/sf |
55 |
16 |
| Aug 4 |
111 |
$1,221/sf |
56 |
15 |
The $4,000,000+ Market:
| Date |
NSDCC Active Listings |
Avg. LP/sf |
Avg. DOM |
# of Pendings |
| Jan 6, 2025 |
160 |
$1,822/sf |
105 |
27 |
| Jan 13 |
156 |
$1,868/sf |
105 |
31 |
| Jan 20 |
170 |
$1,936/sf |
95 |
29 |
| Jan 27 |
180 |
$1,877/sf |
90 |
31 |
| Feb 3 |
189 |
$1,884/sf |
85 |
31 |
| Feb 10 |
189 |
$1,864/sf |
88 |
29 |
| Feb 17 |
192 |
$1,875/sf |
90 |
32 |
| Feb 24 |
195 |
$1,869/sf |
91 |
34 |
| Mar 3 |
200 |
$1,860/sf |
87 |
34 |
| Mar 10 |
213 |
$1,811/sf |
83 |
36 |
| Mar 17 |
208 |
$1,755/sf |
85 |
30 |
| Mar 24 |
211 |
$1,800/sf |
86 |
25 |
| Mar 31 |
213 |
$1,784/sf |
90 |
32 |
| Apr 7 |
219 |
$1,777/sf |
90 |
33 |
| Apr 14 |
230 |
$1,790/sf |
87 |
35 |
| Apr 21 |
231 |
$1,792/sf |
87 |
32 |
| Apr 28 |
235 |
$1,772/sf |
88 |
28 |
| May 5 |
239 |
$1,811/sf |
82 |
30 |
| May 12 |
239 |
$1,811/sf |
85 |
33 |
| May 19 |
255 |
$1,773/sf |
85 |
29 |
| May 26 |
265 |
$1,759/sf |
87 |
24 |
| Jun 2 |
242 |
$1,745/sf |
90 |
29 |
| Jun 9 |
244 |
$1,774/sf |
90 |
33 |
| Jun 16 |
254 |
$1,766/sf |
88 |
34 |
| Jun 23 |
265 |
$1,787/sf |
91 |
30 |
| Jun 30 |
260 |
$1,786/sf |
92 |
40 |
| Jul 7 |
257 |
$1,720/sf |
95 |
41 |
| Jul 14 |
250 |
$1,749/sf |
101 |
45 |
| Jul 21 |
249 |
$1,738/sf |
102 |
44 |
| Jul 28 |
249 |
$1,731/sf |
104 |
47 |
| Aug 4 |
245 |
$1,748/sf |
106 |
46 |
NSDCC Weekly New Listings and New Pendings
| Week |
New Listings |
New Pendings |
Total Actives |
Total Pendings |
| Jan 6 |
27 |
11 |
298 |
108 |
| Jan 13 |
38 |
26 |
301 |
101 |
| Jan 20 |
55 |
16 |
328 |
95 |
| Jan 27 |
60 |
32 |
337 |
113 |
| Feb 3 |
72 |
28 |
363 |
123 |
| Feb 10 |
50 |
34 |
364 |
135 |
| Feb 17 |
50 |
29 |
373 |
140 |
| Feb 24 |
58 |
38 |
374 |
148 |
| Mar 3 |
60 |
31 |
378 |
152 |
| Mar 10 |
60 |
30 |
411 |
156 |
| Mar 17 |
49 |
37 |
413 |
157 |
| Mar 24 |
57 |
39 |
414 |
164 |
| Mar 31 |
47 |
27 |
425 |
162 |
| Apr 7 |
52 |
31 |
431 |
162 |
| Apr 14 |
70 |
28 |
462 |
153 |
| Apr 21 |
58 |
24 |
478 |
148 |
| Apr 28 |
71 |
30 |
501 |
143 |
| May 5 |
82 |
37 |
524 |
154 |
| May 12 |
56 |
39 |
516 |
163 |
| May 19 |
54 |
20 |
543 |
156 |
| May 26 |
58 |
29 |
554 |
146 |
| Jun 2 |
41 |
22 |
535 |
138 |
| Jun 9 |
62 |
25 |
566 |
134 |
| Jun 16 |
68 |
32 |
585 |
142 |
| Jun 23 |
65 |
26 |
612 |
142 |
| Jun 30 |
55 |
37 |
608 |
166 |
| Jul 7 |
43 |
31 |
580 |
169 |
| Jul 14 |
74 |
24 |
601 |
159 |
| Jul 21 |
71 |
37 |
607 |
159 |
| Jul 28 |
46 |
38 |
608 |
166 |
| Aug 4 |
47 |
31 |
603 |
165 |
NSDCC List Price Quartiles
| Week |
1st Quartile |
Median List Price |
3rd Quartile |
| Jan 6 |
$2,685,000 |
$4,472,500 |
$7,995,000 |
| Jan 13 |
$2,499,000 |
$4,250,000 |
$7,750,000 |
| Jan 20 |
$2,695,000 |
$4,300,000 |
$7,767,000 |
| Jan 27 |
$2,795,000 |
$4,498,000 |
$7,995,000 |
| Feb 3 |
$2,695,000 |
$4,350,000 |
$7,499,000 |
| Feb 10 |
$2,799,000 |
$4,299,000 |
$7,695,000 |
| Feb 17 |
$2,695,000 |
$4,200,000 |
$7,750,000 |
| Feb 24 |
$2,699,500 |
$4,250,000 |
$7,645,000 |
| Mar 3 |
$2,550,000 |
$4,375,000 |
$7,497,000 |
| Mar 10 |
$2,500,000 |
$4,200,000 |
$7,250,000 |
| Mar 17 |
$2,500,000 |
$4,000,000 |
$6,995,000 |
| Mar 24 |
$2,595,000 |
$4,047,500 |
$7,275,000 |
| Mar 31 |
$2,499,000 |
$4,000,000 |
$7,300,000 |
| Apr 7 |
$2,500,000 |
$4,000,000 |
$6,995,000 |
| Apr 14 |
$2,500,000 |
$3,999,000 |
$6,995,000 |
| Apr 21 |
$2,590,000 |
$3,995,000 |
$6,799,500 |
| Apr 28 |
$2,490,000 |
$3,988,000 |
$6,500,000 |
| May 5 |
$2,395,000 |
$3,795,000 |
$6,495,000 |
| May 12 |
$2,495,000 |
$3,895,000 |
$6,500,000 |
| May 19 |
$2,495,000 |
$3,950,000 |
$6,595,000 |
| May 26 |
$2,495,000 |
$3,984,500 |
$6,547,500 |
| Jun 2 |
$2,395,000 |
$3,799,000 |
$6,295,500 |
| Jun 9 |
$2,300,000 |
$3,649,000 |
$5,998,500 |
| Jun 16 |
$2,395,000 |
$3,649,000 |
$5,999,000 |
| Jun 23 |
$2,395,000 |
$3,649,500 |
$5,999,500 |
| Jun 30 |
$2,300,000 |
$3,598,500 |
$5,999,000 |
| Jul 7 |
$2,395,000 |
$3,695,500 |
$6,100,000 |
| Jul 14 |
$2,350,000 |
$3,550,000 |
$5,999,000 |
| Jul 21 |
$2,300,000 |
$3,550,000 |
$5,995,000 |
| Jul 28 |
$2,349,000 |
$3,575,000 |
$5,995,000 |
| Aug 4 |
$2,299,949 |
$3,550,000 |
$5,995,000 |