Inventory Watch: August 7, 2023
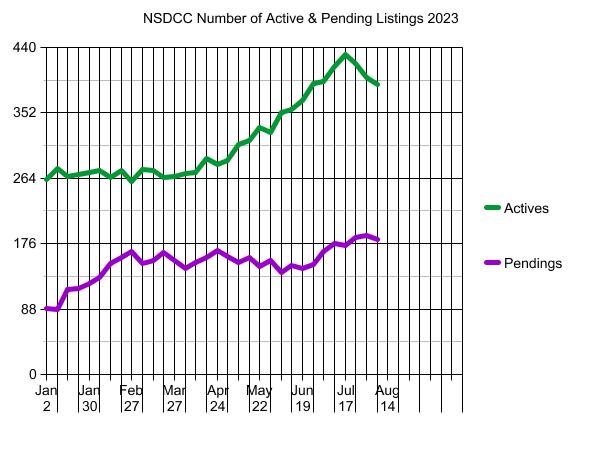
The number of homes for sale between La Jolla and Carlsbad will probably decline for the rest of 2023, even though the pendings counts are as high as they have been all year.
Is the number of pendings higher because pricing is soft, and getting softer?
Generally, the list pricing is fairly steady…..of the unsold listings:
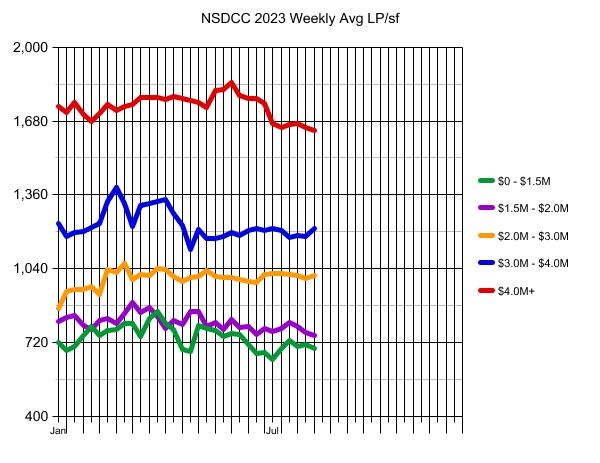
There probably won’t be a noticeable pricing dump the rest of the year – just the occasional deal – because the 2024 Spring Selling Season is only six months away. For most sellers, it’s better to wait, than dump.
The $0 – $1,500,000 Market:
| Date |
NSDCC Active Listings |
Avg. LP/sf |
Avg. DOM |
# of Pendings |
| Jan 2, 2023 |
22 |
$719/sf |
75 |
15 |
| Jan 9 |
26 |
$687/sf |
50 |
14 |
| Jan 16 |
23 |
$701/sf |
52 |
20 |
| Jan 23 |
25 |
$751/sf |
60 |
21 |
| Jan 30 |
23 |
$788/sf |
45 |
25 |
| Feb 6 |
18 |
$750/sf |
59 |
24 |
| Feb 13 |
18 |
$770/sf |
48 |
26 |
| Feb 20 |
17 |
$778/sf |
49 |
26 |
| Feb 27 |
18 |
$802/sf |
48 |
23 |
| Mar 6 |
22 |
$802/sf |
44 |
14 |
| Mar 13 |
22 |
$747/sf |
45 |
16 |
| Mar 20 |
16 |
$826/sf |
49 |
21 |
| Mar 27 |
17 |
$853/sf |
47 |
20 |
| Apr 3 |
19 |
$803/sf |
37 |
20 |
| Apr 10 |
11 |
$778/sf |
53 |
30 |
| Apr 17 |
15 |
$690/sf |
44 |
27 |
| Apr 24 |
12 |
$682/sf |
33 |
25 |
| May 1 |
11 |
$795/sf |
35 |
27 |
| May 8 |
14 |
$780/sf |
33 |
24 |
| May 15 |
16 |
$770/sf |
37 |
22 |
| May 22 |
21 |
$747/sf |
45 |
18 |
| May 29 |
20 |
$757/sf |
52 |
21 |
| Jun 5 |
23 |
$755/sf |
49 |
20 |
| Jun 12 |
17 |
$711/sf |
31 |
32 |
| Jun 19 |
16 |
$674/sf |
34 |
33 |
| Jun 26 |
20 |
$677/sf |
32 |
29 |
| Jul 3 |
21 |
$645/sf |
28 |
33 |
| Jul 10 |
23 |
$692/sf |
30 |
32 |
| Jul 17 |
21 |
$730/sf |
37 |
30 |
| Jul 24 |
21 |
$704/sf |
37 |
32 |
| Jul 31 |
21 |
$713/sf |
44 |
27 |
| Aug 7 |
22 |
$692/sf |
50 |
25 |
The $1,500,000 – $2,000,000 Market:
| Date |
NSDCC Active Listings |
Avg. LP/sf |
Avg. DOM |
# of Pendings |
| Jan 2, 2023 |
45 |
$809/sf |
60 |
18 |
| Jan 9 |
55 |
$828/sf |
53 |
19 |
| Jan 16 |
46 |
$838/sf |
53 |
30 |
| Jan 23 |
43 |
$793/sf |
52 |
31 |
| Jan 30 |
40 |
$778/sf |
54 |
34 |
| Feb 6 |
42 |
$814/sf |
46 |
30 |
| Feb 13 |
35 |
$823/sf |
51 |
39 |
| Feb 20 |
34 |
$801/sf |
47 |
40 |
| Feb 27 |
27 |
$846/sf |
33 |
45 |
| Mar 6 |
29 |
$893/sf |
33 |
41 |
| Mar 13 |
32 |
$850/sf |
33 |
39 |
| Mar 20 |
27 |
$872/sf |
36 |
41 |
| Mar 27 |
22 |
$832/sf |
39 |
36 |
| Apr 3 |
21 |
$779/sf |
27 |
36 |
| Apr 10 |
22 |
$816/sf |
26 |
33 |
| Apr 17 |
27 |
$797/sf |
21 |
33 |
| Apr 24 |
28 |
$856/sf |
31 |
34 |
| Apr 24 |
28 |
$856/sf |
31 |
34 |
| May 1 |
30 |
$789/sf |
28 |
36 |
| May 8 |
36 |
$808/sf |
25 |
37 |
| May 15 |
33 |
$776/sf |
33 |
44 |
| May 22 |
35 |
$818/sf |
36 |
44 |
| May 29 |
38 |
$786/sf |
33 |
40 |
| Jun 5 |
39 |
$791/sf |
34 |
30 |
| Jun 12 |
37 |
$754/sf |
37 |
32 |
| Jun 19 |
36 |
$779/sf |
35 |
35 |
| Jun 26 |
39 |
$766/sf |
34 |
36 |
| Jul 3 |
39 |
$776/sf |
41 |
40 |
| Jul 10 |
45 |
$780/sf |
37 |
39 |
| Jul 17 |
53 |
$807/sf |
29 |
36 |
| Jul 24 |
51 |
$787/sf |
32 |
38 |
| Jul 31 |
51 |
$763/sf |
30 |
39 |
| Aug 7 |
45 |
$750/sf |
36 |
39 |
The $2,000,000 – $3,000,000 Market:
| Date |
NSDCC Active Listings |
Avg. LP/sf |
Avg. DOM |
# of Pendings |
| Jan 2, 2023 |
52 |
$869/sf |
69 |
30 |
| Jan 9 |
57 |
$940/sf |
66 |
31 |
| Jan 16 |
50 |
$948/sf |
61 |
36 |
| Jan 23 |
51 |
$949/sf |
58 |
35 |
| Jan 30 |
54 |
$964/sf |
55 |
34 |
| Feb 6 |
60 |
$930/sf |
51 |
42 |
| Feb 13 |
51 |
$1,038/sf |
52 |
47 |
| Feb 20 |
58 |
$1,022/sf |
47 |
46 |
| Feb 27 |
56 |
$1,064/sf |
52 |
49 |
| Mar 6 |
57 |
$995/sf |
50 |
50 |
| Mar 13 |
55 |
$1,015/sf |
53 |
47 |
| Mar 20 |
50 |
$1,011/sf |
58 |
50 |
| Mar 27 |
54 |
$1,039/sf |
49 |
47 |
| Apr 3 |
54 |
$1,035/sf |
52 |
38 |
| Apr 10 |
55 |
$1,004/sf |
48 |
42 |
| Apr 17 |
64 |
$985/sf |
47 |
46 |
| Apr 24 |
57 |
$1,001/sf |
43 |
50 |
| May 1 |
57 |
$1,008/sf |
42 |
45 |
| May 8 |
68 |
$1,031/sf |
36 |
41 |
| May 15 |
71 |
$1,007/sf |
34 |
39 |
| May 22 |
77 |
$1,003/sf |
34 |
38 |
| May 29 |
74 |
$1,002/sf |
39 |
43 |
| Jun 5 |
77 |
$991/sf |
42 |
44 |
| Jun 12 |
82 |
$986/sf |
48 |
45 |
| Jun 19 |
90 |
$978/sf |
48 |
33 |
| Jun 26 |
90 |
$1,015/sf |
49 |
33 |
| Jul 3 |
92 |
$1,019/sf |
49 |
36 |
| Jul 10 |
89 |
$1,021/sf |
50 |
44 |
| Jul 17 |
97 |
$1,013/sf |
48 |
42 |
| Jul 24 |
91 |
$1,010/sf |
48 |
42 |
| Jul 31 |
81 |
$999/sf |
56 |
52 |
| Aug 7 |
81 |
$1,011/sf |
53 |
49 |
The $3,000,000 – $4,000,000 Market:
| Date |
NSDCC Active Listings |
Avg. LP/sf |
Avg. DOM |
# of Pendings |
| Jan 2, 2023 |
29 |
$1,236/sf |
85 |
6 |
| Jan 9 |
29 |
$1,180/sf |
80 |
5 |
| Jan 16 |
31 |
$1,196/sf |
73 |
8 |
| Jan 23 |
33 |
$1,201/sf |
71 |
7 |
| Jan 30 |
37 |
$1,218/sf |
70 |
6 |
| Feb 6 |
34 |
$1,236/sf |
75 |
12 |
| Feb 13 |
43 |
$1,333/sf |
68 |
11 |
| Feb 20 |
39 |
$1,392/sf |
71 |
18 |
| Feb 27 |
37 |
$1,323/sf |
68 |
22 |
| Mar 6 |
49 |
$1,222/sf |
56 |
20 |
| Mar 13 |
49 |
$1,312/sf |
49 |
22 |
| Mar 20 |
46 |
$1,321/sf |
52 |
25 |
| Mar 27 |
50 |
$1,329/sf |
52 |
25 |
| Apr 3 |
49 |
$1,342/sf |
51 |
23 |
| Apr 10 |
50 |
$1,321/sf |
57 |
24 |
| Apr 17 |
47 |
$1,342/sf |
59 |
26 |
| Apr 24 |
49 |
$1,281/sf |
63 |
28 |
| May 1 |
53 |
$1,227/sf |
62 |
23 |
| May 8 |
55 |
$1,122/sf |
63 |
19 |
| May 15 |
57 |
$1,211/sf |
59 |
19 |
| May 22 |
59 |
$1,170/sf |
61 |
19 |
| May 29 |
60 |
$1,171/sf |
60 |
17 |
| Jun 5 |
70 |
$1,178/sf |
55 |
15 |
| Jun 12 |
64 |
$1,198/sf |
53 |
18 |
| Jun 19 |
67 |
$1,184/sf |
54 |
20 |
| Jun 26 |
66 |
$1,204/sf |
58 |
25 |
| Jul 3 |
63 |
$1,215/sf |
58 |
22 |
| Jul 10 |
72 |
$1,204/sf |
59 |
23 |
| Jul 17 |
79 |
$1,173/sf |
64 |
22 |
| Jul 24 |
78 |
$1,182/sf |
63 |
23 |
| Jul 31 |
69 |
$1,181/sf |
66 |
22 |
| Aug 7 |
72 |
$1,214/sf |
65 |
19 |
The $4,000,000+ Market:
| Date |
NSDCC Active Listings |
Avg. LP/sf |
Avg. DOM |
# of Pendings |
| Jan 2, 2023 |
121 |
$1,744/sf |
126 |
21 |
| Jan 9 |
119 |
$1,716/sf |
123 |
20 |
| Jan 16 |
120 |
$1,761/sf |
121 |
26 |
| Jan 23 |
122 |
$1,707/sf |
119 |
27 |
| Jan 30 |
120 |
$1,680/sf |
121 |
30 |
| Feb 6 |
125 |
$1,714/sf |
118 |
28 |
| Feb 13 |
121 |
$1,750/sf |
116 |
32 |
| Feb 20 |
129 |
$1,725/sf |
112 |
33 |
| Feb 27 |
124 |
$1,743/sf |
115 |
31 |
| Mar 6 |
122 |
$1,753/sf |
109 |
28 |
| Mar 13 |
120 |
$1,782/sf |
109 |
32 |
| Mar 20 |
129 |
$1,783/sf |
106 |
28 |
| Mar 27 |
127 |
$1,781/sf |
106 |
27 |
| Apr 3 |
131 |
$1,774/sf |
105 |
27 |
| Apr 10 |
136 |
$1,788/sf |
107 |
24 |
| Apr 17 |
140 |
$1,776/sf |
108 |
27 |
| Apr 24 |
141 |
$1,771/sf |
107 |
31 |
| May 1 |
142 |
$1,760/sf |
105 |
30 |
| May 8 |
140 |
$1,737/sf |
104 |
32 |
| May 15 |
141 |
$1,812/sf |
107 |
37 |
| May 22 |
145 |
$1,816/sf |
106 |
29 |
| May 29 |
142 |
$1,846/sf |
110 |
36 |
| Jun 5 |
152 |
$1,791/sf |
107 |
31 |
| Jun 12 |
163 |
$1,777/sf |
106 |
24 |
| Jun 19 |
166 |
$1,779/sf |
102 |
26 |
| Jun 26 |
179 |
$1,758/sf |
98 |
29 |
| Jul 3 |
184 |
$1,670/sf |
91 |
39 |
| Jul 10 |
192 |
$1,653/sf |
92 |
42 |
| Jul 17 |
187 |
$1,666/sf |
94 |
47 |
| Jul 24 |
185 |
$1,668/sf |
98 |
49 |
| Jul 31 |
184 |
$1,653/sf |
102 |
51 |
| Aug 7 |
178 |
$1,639/sf |
101 |
51 |
NSDCC Weekly New Listings and New Pendings
| Week |
New Listings |
New Pendings |
Total Actives |
Total Pendings |
| Jan 2, 2023 |
11 |
6 |
263 |
89 |
| Jan 9 |
36 |
15 |
277 |
88 |
| Jan 16 |
36 |
34 |
266 |
114 |
| Jan 23 |
36 |
22 |
269 |
116 |
| Jan 30 |
32 |
25 |
272 |
123 |
| Feb 6 |
46 |
33 |
275 |
131 |
| Feb 13 |
30 |
35 |
265 |
150 |
| Feb 20 |
43 |
34 |
274 |
158 |
| Feb 27 |
27 |
30 |
260 |
165 |
| Mar 6 |
45 |
28 |
276 |
150 |
| Mar 13 |
38 |
38 |
274 |
154 |
| Mar 20 |
39 |
37 |
265 |
164 |
| Mar 27 |
36 |
25 |
267 |
153 |
| Apr 3 |
37 |
28 |
271 |
143 |
| Apr 10 |
36 |
39 |
272 |
151 |
| Apr 17 |
47 |
27 |
291 |
157 |
| Apr 24 |
46 |
41 |
282 |
167 |
| May 1 |
59 |
31 |
288 |
159 |
| May 8 |
53 |
26 |
310 |
151 |
| May 15 |
48 |
31 |
315 |
157 |
| May 22 |
50 |
24 |
332 |
145 |
| May 29 |
43 |
37 |
325 |
154 |
| Jun 5 |
43 |
17 |
352 |
137 |
| Jun 12 |
52 |
36 |
357 |
146 |
| Jun 19 |
48 |
30 |
369 |
143 |
| Jun 26 |
65 |
26 |
391 |
148 |
| Jul 3 |
60 |
48 |
394 |
166 |
| Jul 10 |
51 |
34 |
415 |
176 |
| Jul 17 |
55 |
28 |
430 |
173 |
| Jul 24 |
37 |
43 |
419 |
184 |
| Jul 31 |
48 |
44 |
399 |
187 |
| Aug 7 |
43 |
32 |
390 |
181 |
NSDCC Weekly LP Quartiles
| Week |
1st Quartile |
2nd Quartile (Median LP) |
3rd Quartile |
| Jan 2, 2023 |
$2,095,000 |
$3,695,000 |
$5,995,000 |
| Jan 9 |
$1,990,000 |
$3,495,000 |
$5,775,000 |
| Jan 16 |
$2,000,000 |
$3,574,000 |
$5,995,000 |
| Jan 23 |
$2,099,000 |
$3,595,000 |
$5,999,000 |
| Jan 30 |
$2,195,000 |
$3,525,000 |
$5,942,000 |
| Feb 6 |
$2,195,000 |
$3,598,000 |
$6,845,000 |
| Feb 13 |
$2,300,000 |
$3,795,000 |
$6,495,000 |
| Feb 20 |
$2,397,500 |
$3,950,000 |
$6,197,500 |
| Feb 27 |
$2,480,800 |
$3,970,000 |
$6,845,000 |
| Mar 6 |
$2,395,000 |
$3,749,500 |
$5,995,000 |
| Mar 13 |
$2,397,000 |
$3,772,500 |
$5,997,000 |
| Mar 20 |
$2,580,000 |
$3,995,000 |
$6,800,000 |
| Mar 27 |
$2,595,000 |
$3,995,000 |
$6,845,000 |
| Apr 3 |
$2,699,000 |
$3,995,000 |
$6,750,000 |
| Apr 10 |
$2,799,500 |
$4,074,997 |
$6,895,000 |
| Apr 17 |
$2,600,000 |
$3,995,000 |
$6,597,000 |
| Apr 24 |
$2,685,000 |
$4,074,997 |
$6,895,000 |
| May 1 |
$2,695,000 |
$3,999,000 |
$6,495,000 |
| May 8 |
$2,525,000 |
$3,849,949 |
$5,946,000 |
| May 15 |
$2,495,000 |
$3,749,400 |
$5,950,000 |
| May 22 |
$2,444,000 |
$3,695,400 |
$6,000,000 |
| May 29 |
$2,495,000 |
$3,699,000 |
$6,395,000 |
| Jun 5 |
$2,450,000 |
$3,641,500 |
$6,000,000 |
| Jun 12 |
$2,499,900 |
$3,799,999 |
$6,496,000 |
| Jun 19 |
$2,495,000 |
$3,750,000 |
$6,497,000 |
| Jun 26 |
$2,450,000 |
$3,799,000 |
$6,495,000 |
| Jul 3 |
$2,479,000 |
$3,891,500 |
$6,235,000 |
| Jul 10 |
$2,468,000 |
$3,900,000 |
$5,998,985 |
| Jul 17 |
$2,350,000 |
$3,669,000 |
$5,949,000 |
| Jul 24 |
$2,399,000 |
$3,799,999 |
$5,995,000 |
| Jul 31 |
$2,395,000 |
$3,888,000 |
$6,245,000 |
| Aug 7 |
$2,492,000 |
$3,895,000 |
$6,345,000 |