
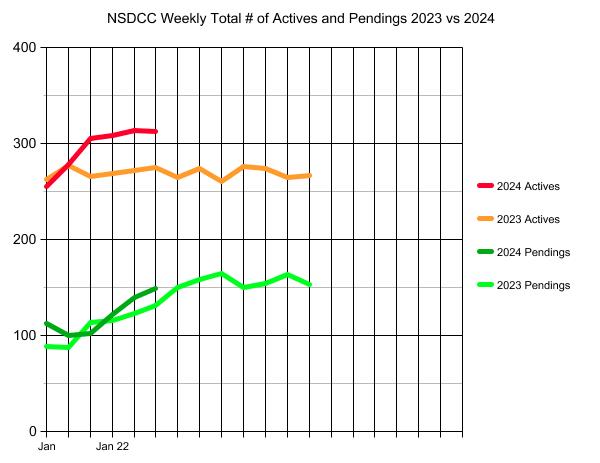
The number of January listings has blown by everyone’s expectations, and is now up to 229, which is 12% higher than in January, 2023 – and the count isn’t done yet.
All we know for sure is that more sellers wanted to get an early start on moving this year.
If that tendency holds up over the next few months and the YoY inventory grows by 10% or more each month, the market could get more frenzied, because the buyers are responding too. The number of pendings is 14% higher than they were last year at this time!
My theory is that 10% more inventory is easily absorbed and really won’t be that noticeable. It’s when the inventory is growing at 20% or more that buyers may wonder what’s going on – and be tempted to pause, and/or get more picky, if that is possible.
Congratulations to Joe – the winner of the four Padres tickets!
Contest to Guess the Total Number of NSDCC January Listings
142 Anne M
157 Skip
160 doughboy
170 Dale
174 SurfRider
176 LifeIsRadInCbad
180 Kingside
188 Stephanie R.
189 Chris
190 Tom
192 Sara G.
196 Derek
200 Curtis
208 Rob Dawg
210 Bode
213 Shadash
217 Nick
222 Majeed
223 Joe
The way it’s going, the 2024 Selling Season should be as hot, or hotter than it was last year!
The $0 – $1,500,000 Market:
| Date | ||||
| Jan 2, 2024 | ||||
| Jan 8 | ||||
| Jan 15 | ||||
| Jan 22 | ||||
| Jan 29 | ||||
| Feb 5 |
The $1,500,000 – $2,000,000 Market:
| Date | ||||
| Jan 2, 2024 | ||||
| Jan 8 | ||||
| Jan 15 | ||||
| Jan 22 | ||||
| Jan 29 | ||||
| Feb 5 |
The $2,000,000 – $3,000,000 Market:
| Date | ||||
| Jan 2, 2024 | ||||
| Jan 8 | ||||
| Jan 15 | ||||
| Jan 22 | ||||
| Jan 29 | ||||
| Feb 5 |
The $3,000,000 – $4,000,000 Market:
| Date | ||||
| Jan 2, 2024 | ||||
| Jan 8 | ||||
| Jan 15 | ||||
| Jan 22 | ||||
| Jan 29 | ||||
| Feb 5 |
The $4,000,000+ Market:
| Date | ||||
| Jan 2, 2024 | ||||
| Jan 8 | ||||
| Jan 15 | ||||
| Jan 22 | ||||
| Jan 29 | ||||
| Feb 5 |
NSDCC Weekly New Listings and New Pendings
| Week | ||||
| Jan 2, 2024 | ||||
| Jan 8 | ||||
| Jan 15 | ||||
| Jan 22 | ||||
| Jan 29 | ||||
| Feb 5 |
NSDCC List Price Quartiles
| Week | |||
| Jan 2, 2024 | |||
| Jan 8 | |||
| Jan 15 | |||
| Jan 22 | |||
| Jan 29 | |||
| Feb 5 |