Inventory Watch: May 4th
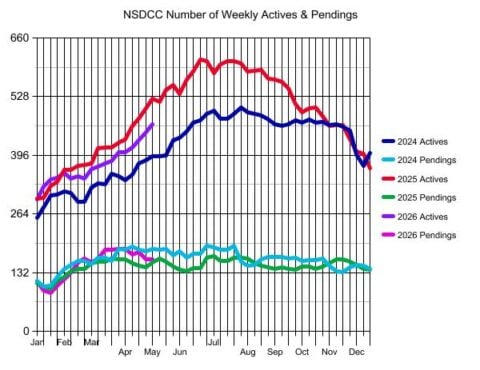
The NSDCC active listings have been rising at about the same number and pace as they were last year – just pushed out three weeks later. It’s good to have adequate inventory.
It’s the pendings count that could become interesting.
The number of pendings is already well under the 2024 count at this time, and it could slip under the 2025 number in the next week or two.
This is all while the average LP/sf of the active (unsold) listings has been plummeting.
Today, the high-end (Over-$4M) actives have slipped under $1,800/sf for the first time in 2026. It was over $1,900/sf when this year began!
The $0 – $2,000,000 Market:
| Date |
NSDCC Active Listings |
Avg. LP/sf |
Avg. DOM |
# of Pendings |
| Jan 5, 2026 |
43 |
$855/sf |
50 |
32 |
| Jan 12 |
45 |
$855/sf |
52 |
21 |
| Jan 19 |
49 |
$843/sf |
59 |
22 |
| Jan 26 |
44 |
$836/sf |
50 |
26 |
| Feb 2 |
55 |
$882/sf |
38 |
32 |
| Feb 9 |
50 |
$862/sf |
42 |
36 |
| Feb 16 |
52 |
$848/sf |
36 |
45 |
| Feb 23 |
47 |
$872/sf |
35 |
48 |
| Mar 2 |
54 |
$847/sf |
43 |
43 |
| Mar 9 |
54 |
$860/sf |
37 |
46 |
| Mar 16 |
57 |
$846/sf |
38 |
51 |
| Mar 23 |
57 |
$860/sf |
40 |
46 |
| Mar 30 |
59 |
$893/sf |
42 |
45 |
| Apr 6 |
65 |
$890/sf |
40 |
41 |
| Apr 13 |
56 |
$885/sf |
44 |
43 |
| Apr 20 |
55 |
$871/sf |
42 |
49 |
| Apr 27 |
56 |
$852/sf |
44 |
41 |
| May 4 |
63 |
$831/sf |
38 |
49 |
The $2,000,000 – $3,000,000 Market:
| Date |
NSDCC Active Listings |
Avg. LP/sf |
Avg. DOM |
# of Pendings |
| Jan 5, 2026 |
45 |
$955/sf |
72 |
26 |
| Jan 12 |
56 |
$981/sf |
59 |
24 |
| Jan 19 |
60 |
$985/sf |
55 |
23 |
| Jan 26 |
65 |
$1,014/sf |
53 |
28 |
| Feb 2 |
67 |
$1,013/sf |
51 |
33 |
| Feb 9 |
69 |
$1,063/sf |
56 |
33 |
| Feb 16 |
68 |
$1,030/sf |
56 |
40 |
| Feb 23 |
66 |
$1,045/sf |
58 |
41 |
| Mar 2 |
76 |
$1,082/sf |
50 |
42 |
| Mar 9 |
74 |
$1,078/sf |
53 |
50 |
| Mar 16 |
77 |
$1,087/sf |
53 |
60 |
| Mar 23 |
79 |
$1,056/sf |
48 |
61 |
| Mar 30 |
84 |
$1,083/sf |
48 |
63 |
| Apr 6 |
83 |
$1,104/sf |
51 |
71 |
| Apr 13 |
89 |
$1,077/sf |
49 |
56 |
| Apr 20 |
89 |
$1,068/sf |
46 |
53 |
| Apr 27 |
95 |
$1,073/sf |
46 |
47 |
| May 4 |
105 |
$1,067/sf |
48 |
45 |
The $3,000,000 – $4,000,000 Market:
| Date |
NSDCC Active Listings |
Avg. LP/sf |
Avg. DOM |
# of Pendings |
| Jan 5, 2026 |
56 |
$1,299/sf |
90 |
19 |
| Jan 12 |
62 |
$1,292/sf |
71 |
14 |
| Jan 19 |
65 |
$1,265/sf |
66 |
14 |
| Jan 26 |
63 |
$1,304/sf |
72 |
20 |
| Feb 2 |
60 |
$1,319/sf |
76 |
22 |
| Feb 9 |
51 |
$1,387/sf |
76 |
30 |
| Feb 16 |
58 |
$1,241/sf |
60 |
31 |
| Feb 23 |
52 |
$1,233/sf |
68 |
33 |
| Mar 2 |
50 |
$1,210/sf |
63 |
32 |
| Mar 9 |
54 |
$1,188/sf |
60 |
29 |
| Mar 16 |
57 |
$1,184/sf |
55 |
29 |
| Mar 23 |
53 |
$1,154/sf |
60 |
33 |
| Mar 30 |
58 |
$1,174/sf |
49 |
30 |
| Apr 6 |
61 |
$1,224/sf |
57 |
28 |
| Apr 13 |
70 |
$1,209/sf |
52 |
26 |
| Apr 20 |
75 |
$1,208/sf |
52 |
28 |
| Apr 27 |
75 |
$1,184/sf |
56 |
28 |
| May 4 |
78 |
$1,165/sf |
54 |
24 |
The $4,000,000+ Market:
| Date |
NSDCC Active Listings |
Avg. LP/sf |
Avg. DOM |
# of Pendings |
| Jan 5, 2026 |
154 |
$1,927/sf |
127 |
36 |
| Jan 12 |
164 |
$1,896/sf |
119 |
32 |
| Jan 19 |
168 |
$1,858/sf |
115 |
28 |
| Jan 26 |
174 |
$1,906/sf |
113 |
30 |
| Feb 2 |
175 |
$1,892/sf |
109 |
31 |
| Feb 9 |
174 |
$1,842/sf |
103 |
34 |
| Feb 16 |
173 |
$1,863/sf |
108 |
39 |
| Feb 23 |
181 |
$1,883/sf |
110 |
43 |
| Mar 2 |
186 |
$1,853/sf |
109 |
40 |
| Mar 9 |
190 |
$1,870/sf |
112 |
40 |
| Mar 16 |
188 |
$1,885/sf |
112 |
45 |
| Mar 23 |
195 |
$1,854/sf |
112 |
47 |
| Mar 30 |
204 |
$1,868/sf |
112 |
49 |
| Apr 6 |
196 |
$1,872/sf |
112 |
48 |
| Apr 13 |
201 |
$1,826/sf |
114 |
48 |
| Apr 20 |
216 |
$1,821/sf |
109 |
48 |
| Apr 27 |
226 |
$1,811/sf |
105 |
46 |
| May 4 |
223 |
$1,781/sf |
101 |
44 |
NSDCC Weekly New Listings and New Pendings
| Week |
New Listings |
New Pendings |
Total Actives |
Total Pendings |
| Jan 5 |
24 |
12 |
296 |
112 |
| Jan 12 |
48 |
10 |
325 |
91 |
| Jan 19 |
55 |
22 |
342 |
86 |
| Jan 26 |
44 |
22 |
346 |
103 |
| Feb 2 |
45 |
29 |
356 |
116 |
| Feb 9 |
43 |
30 |
343 |
132 |
| Feb 16 |
55 |
37 |
349 |
154 |
| Feb 23 |
43 |
39 |
344 |
163 |
| Mar 2 |
55 |
26 |
365 |
155 |
| Mar 9 |
57 |
44 |
370 |
164 |
| Mar 16 |
62 |
39 |
377 |
184 |
| Mar 23 |
55 |
33 |
383 |
184 |
| Mar 30 |
56 |
37 |
403 |
185 |
| Apr 6 |
56 |
40 |
402 |
186 |
| Apr 13 |
55 |
36 |
413 |
172 |
| Apr 20 |
63 |
35 |
430 |
178 |
| Apr 27 |
69 |
29 |
447 |
162 |
| May 4 |
56 |
30 |
465 |
162 |
NSDCC List Price Quartiles
| Week |
1st Quartile |
Median List Price |
3rd Quartile |
| Jan 5 |
$2,849,000 |
$4,295,000 |
$6,999,000 |
| Jan 12 |
$2,729,000 |
$4,175,000 |
$6,850,000 |
| Jan 19 |
$2,650,000 |
$3,995,000 |
$6,574,000 |
| Jan 26 |
$2,670,000 |
$4,137,500 |
$6,800,000 |
| Feb 2 |
$2,499,999 |
$3,995,000 |
$6,495,000 |
| Feb 9 |
$2,500,000 |
$4,175,000 |
$6,500,000 |
| Feb 16 |
$2,575,000 |
$3,995,000 |
$6,500,000 |
| Feb 23 |
$2,650,000 |
$4,272,500 |
$6,995,000 |
| Mar 2 |
$2,498,000 |
$4,190,000 |
$6,749,000 |
| Mar 9 |
$2,562,500 |
$4,249,500 |
$6,772,000 |
| Mar 16 |
$2,550,000 |
$3,999,000 |
$6,995,000 |
| Mar 23 |
$2,500,000 |
$4,250,000 |
$6,995,000 |
| Mar 30 |
$2,590,000 |
$4,150,000 |
$6,850,000 |
| Apr 6 |
$2,495,000 |
$3,995,000 |
$6,749,500 |
| Apr 13 |
$2,500,000 |
$3,995,000 |
$6,850,000 |
| Apr 20 |
$2,595,000 |
$4,000,000 |
$6,995,000 |
| Apr 27 |
$2,599,000 |
$4,100,000 |
$6,995,000 |
| May 4 |
$2,549,000 |
$3,995,000 |
$6,750,000 |