Inventory Watch: September 7t
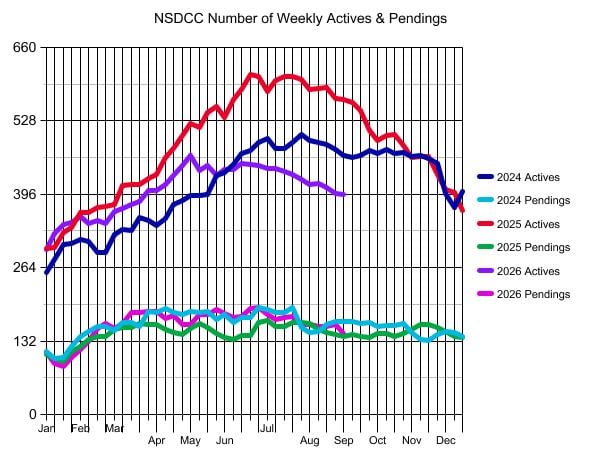
The number of pending listings has taken a nose dive and there have only been 16 new pendings added this month. It means the sales counts will probably struggle to reach 100 per month for the rest of the year.
It’s not a problem, as long as you don’t have to sell.
We could start off 2027 with a few hundred old listings from this year. If so, it will not only feel a little sluggish but they will also be price markers that encourage new sellers to list higher.
There’s nothing price won’t fix!
The $0 – $2,000,000 Market:
Date | NSDCC Active Listings | Avg. LP/sf | Avg. DOM | # of Pendings |
Jan 5, 2026 | 43 | $855/sf | 50 | 32 |
Jan 12 | 45 | $855/sf | 52 | 21 |
Jan 19 | 49 | $843/sf | 59 | 22 |
Jan 26 | 44 | $836/sf | 50 | 26 |
Feb 2 | 55 | $882/sf | 38 | 32 |
Feb 9 | 50 | $862/sf | 42 | 36 |
Feb 16 | 52 | $848/sf | 36 | 45 |
Feb 23 | 47 | $872/sf | 35 | 48 |
Mar 2 | 54 | $847/sf | 43 | 43 |
Mar 9 | 54 | $860/sf | 37 | 46 |
Mar 16 | 57 | $846/sf | 38 | 51 |
Mar 23 | 57 | $860/sf | 40 | 46 |
Mar 30 | 59 | $893/sf | 42 | 45 |
Apr 6 | 65 | $890/sf | 40 | 41 |
Apr 13 | 56 | $885/sf | 44 | 43 |
Apr 20 | 55 | $871/sf | 42 | 49 |
Apr 27 | 56 | $852/sf | 44 | 41 |
May 4 | 63 | $831/sf | 38 | 49 |
May 11 | 59 | $828/sf | 43 | 47 |
May 18 | 60 | $848/sf | 43 | 51 |
May 25 | 48 | $839/sf | 51 | 59 |
Jun 1 | 49 | $846/sf | 53 | 57 |
Jun 8 | 52 | $854/sf | 55 | 50 |
Jun 15 | 60 | $845/sf | 51 | 51 |
Jun 22 | 61 | $843/sf | 45 | 53 |
Jun 29 | 58 | $836/sf | 42 | 53 |
Jul 6 | 59 | $841/sf | 39 | 49 |
Jul 13 | 53 | $823/sf | 42 | 49 |
Jul 20 | 46 | $836/sf | 46 | 52 |
Jul 27 | 46 | $814/sf | 48 | 53 |
Aug 3 | 43 | $800/sf | 45 | 46 |
Aug 10 | 49 | $811/sf | 42 | 42 |
Aug 17 | 49 | $796/sf | 41 | 44 |
Aug 24 | 46 | $797/sf | 46 | 44 |
Aug 31 | 49 | $800/sf | 46 | 40 |
The $2,000,000 – $3,000,000 Market:
Date | NSDCC Active Listings | Avg. LP/sf | Avg. DOM | # of Pendings |
Jan 5, 2026 | 45 | $955/sf | 72 | 26 |
Jan 12 | 56 | $981/sf | 59 | 24 |
Jan 19 | 60 | $985/sf | 55 | 23 |
Jan 26 | 65 | $1,014/sf | 53 | 28 |
Feb 2 | 67 | $1,013/sf | 51 | 33 |
Feb 9 | 69 | $1,063/sf | 56 | 33 |
Feb 16 | 68 | $1,030/sf | 56 | 40 |
Feb 23 | 66 | $1,045/sf | 58 | 41 |
Mar 2 | 76 | $1,082/sf | 50 | 42 |
Mar 9 | 74 | $1,078/sf | 53 | 50 |
Mar 16 | 77 | $1,087/sf | 53 | 60 |
Mar 23 | 79 | $1,056/sf | 48 | 61 |
Mar 30 | 84 | $1,083/sf | 48 | 63 |
Apr 6 | 83 | $1,104/sf | 51 | 71 |
Apr 13 | 89 | $1,077/sf | 49 | 56 |
Apr 20 | 89 | $1,068/sf | 46 | 53 |
Apr 27 | 95 | $1,073/sf | 46 | 47 |
May 4 | 105 | $1,067/sf | 48 | 45 |
May 11 | 91 | $1,083/sf | 49 | 54 |
May 18 | 89 | $1,102/sf | 52 | 53 |
May 25 | 91 | $1,063/sf | 51 | 53 |
Jun 1 | 98 | $1,079/sf | 49 | 52 |
Jun 8 | 96 | $1,061/sf | 50 | 51 |
Jun 15 | 96 | $1,069/sf | 52 | 53 |
Jun 22 | 101 | $1,061/sf | 46 | 58 |
Jun 29 | 99 | $1,085/sf | 46 | 63 |
Jul 6 | 95 | $1,104/sf | 50 | 58 |
Jul 13 | 104 | $1,072/sf | 49 | 51 |
Jul 20 | 97 | $1,044/sf | 48 | 51 |
Jul 27 | 95 | $1,024/sf | 46 | 56 |
Aug 3 | 91 | $1,034/sf | 43 | 59 |
Aug 10 | 81 | $1,026/sf | 47 | 63 |
Aug 17 | 80 | $1,080/sf | 48 | 56 |
Aug 24 | 79 | $1,089/sf | 52 | 52 |
Aug 31 | 73 | $1,095/sf | 53 | 53 |
The $3,000,000 – $4,000,000 Market:
Date | NSDCC Active Listings | Avg. LP/sf | Avg. DOM | # of Pendings |
Jan 5, 2026 | 56 | $1,299/sf | 90 | 19 |
Jan 12 | 62 | $1,292/sf | 71 | 14 |
Jan 19 | 65 | $1,265/sf | 66 | 14 |
Jan 26 | 63 | $1,304/sf | 72 | 20 |
Feb 2 | 60 | $1,319/sf | 76 | 22 |
Feb 9 | 51 | $1,387/sf | 76 | 30 |
Feb 16 | 58 | $1,241/sf | 60 | 31 |
Feb 23 | 52 | $1,233/sf | 68 | 33 |
Mar 2 | 50 | $1,210/sf | 63 | 32 |
Mar 9 | 54 | $1,188/sf | 60 | 29 |
Mar 16 | 57 | $1,184/sf | 55 | 29 |
Mar 23 | 53 | $1,154/sf | 60 | 33 |
Mar 30 | 58 | $1,174/sf | 49 | 30 |
Apr 6 | 61 | $1,224/sf | 57 | 28 |
Apr 13 | 70 | $1,209/sf | 52 | 26 |
Apr 20 | 75 | $1,208/sf | 52 | 28 |
Apr 27 | 75 | $1,184/sf | 56 | 28 |
May 4 | 78 | $1,165/sf | 54 | 24 |
May 11 | 69 | $1,159/sf | 62 | 32 |
May 18 | 76 | $1,211/sf | 69 | 30 |
May 25 | 70 | $1,215/sf | 69 | 31 |
Jun 1 | 67 | $1,196/sf | 72 | 29 |
Jun 8 | 69 | $1,240/sf | 69 | 27 |
Jun 15 | 70 | $1,209/sf | 69 | 29 |
Jun 22 | 66 | $1,245/sf | 70 | 36 |
Jun 29 | 66 | $1,271/sf | 74 | 29 |
Jul 6 | 66 | $1,251/sf | 77 | 26 |
Jul 13 | 66 | $1,262/sf | 77 | 28 |
Jul 20 | 67 | $1,247/sf | 80 | 26 |
Jul 27 | 66 | $1,247/sf | 82 | 21 |
Aug 3 | 65 | $1,273/sf | 85 | 12 |
Aug 10 | 65 | $1,284/sf | 87 | 18 |
Aug 17 | 68 | $1,282/sf | 74 | 20 |
Aug 24 | 72 | $1,240/sf | 77 | 21 |
Aug 31 | 71 | $1,277/sf | 79 | 26 |
The $4,000,000+ Market:
Date | NSDCC Active Listings | Avg. LP/sf | Avg. DOM | # of Pendings |
Jan 5, 2026 | 154 | $1,927/sf | 127 | 36 |
Jan 12 | 164 | $1,896/sf | 119 | 32 |
Jan 19 | 168 | $1,858/sf | 115 | 28 |
Jan 26 | 174 | $1,906/sf | 113 | 30 |
Feb 2 | 175 | $1,892/sf | 109 | 31 |
Feb 9 | 174 | $1,842/sf | 103 | 34 |
Feb 16 | 173 | $1,863/sf | 108 | 39 |
Feb 23 | 181 | $1,883/sf | 110 | 43 |
Mar 2 | 186 | $1,853/sf | 109 | 40 |
Mar 9 | 190 | $1,870/sf | 112 | 40 |
Mar 16 | 188 | $1,885/sf | 112 | 45 |
Mar 23 | 195 | $1,854/sf | 112 | 47 |
Mar 30 | 204 | $1,868/sf | 112 | 49 |
Apr 6 | 196 | $1,872/sf | 112 | 48 |
Apr 13 | 201 | $1,826/sf | 114 | 48 |
Apr 20 | 216 | $1,821/sf | 109 | 48 |
Apr 27 | 226 | $1,811/sf | 105 | 46 |
May 4 | 223 | $1,781/sf | 101 | 44 |
May 11 | 223 | $1,782/sf | 104 | 46 |
May 18 | 225 | $1,782/sf | 99 | 45 |
May 25 | 225 | $1,752/sf | 99 | 46 |
Jun 1 | 230 | $1,767/sf | 97 | 43 |
Jun 8 | 230 | $1,763/sf | 95 | 47 |
Jun 15 | 234 | $1,771/sf | 97 | 43 |
Jun 22 | 229 | $1,756/sf | 98 | 45 |
Jun 29 | 231 | $1,739/sf | 99 | 48 |
Jul 6 | 228 | $1,732/sf | 101 | 47 |
Jul 13 | 225 | $1,664/sf | 102 | 44 |
Jul 20 | 233 | $1,666/sf | 99 | 46 |
Jul 27 | 231 | $1,693/sf | 105 | 47 |
Aug 3 | 230 | $1,715/sf | 105 | 45 |
Aug 10 | 226 | $1,720/sf | 108 | 40 |
Aug 17 | 231 | $1,728/sf | 107 | 40 |
Aug 24 | 222 | $1,776/sf | 108 | 43 |
Aug 31 | 214 | $1,750/sf | 111 | 44 |
NSDCC Weekly New Listings and New Pendings
Week | New Listings | New Pendings | Total Actives | Total Pendings |
Jan 5 | 24 | 12 | 296 | 112 |
Jan 12 | 48 | 10 | 325 | 91 |
Jan 19 | 55 | 22 | 342 | 86 |
Jan 26 | 44 | 22 | 346 | 103 |
Feb 2 | 45 | 29 | 356 | 116 |
Feb 9 | 43 | 30 | 343 | 132 |
Feb 16 | 55 | 37 | 349 | 154 |
Feb 23 | 43 | 39 | 344 | 163 |
Mar 2 | 55 | 26 | 365 | 155 |
Mar 9 | 57 | 44 | 370 | 164 |
Mar 16 | 62 | 39 | 377 | 184 |
Mar 23 | 55 | 33 | 383 | 184 |
Mar 30 | 56 | 37 | 403 | 185 |
Apr 6 | 56 | 40 | 402 | 186 |
Apr 13 | 55 | 36 | 413 | 172 |
Apr 20 | 63 | 35 | 430 | 178 |
Apr 27 | 69 | 29 | 447 | 162 |
May 4 | 56 | 30 | 465 | 162 |
May 11 | 39 | 41 | 439 | 179 |
May 18 | 53 | 27 | 447 | 179 |
May 25 | 48 | 35 | 430 | 189 |
Jun 1 | 50 | 20 | 440 | 181 |
Jun 8 | 49 | 42 | 440 | 175 |
Jun 15 | 69 | 36 | 452 | 176 |
Jun 22 | 64 | 41 | 450 | 191 |
Jun 29 | 58 | 39 | 447 | 192 |
Jul 6 | 32 | 22 | 442 | 179 |
Jul 13 | 50 | 27 | 443 | 171 |
Jul 20 | 58 | 45 | 437 | 174 |
Jul 27 | 43 | 35 | 432 | 176 |
Aug 3 | 46 | 25 | 422 | 161 |
Aug 10 | 38 | 30 | 414 | 162 |
Aug 17 | 57 | 29 | 415 | 158 |
Aug 24 | 42 | 22 | 409 | 158 |
Aug 31 | 38 | 25 | 397 | 162 |
NSDCC List Price Quartiles
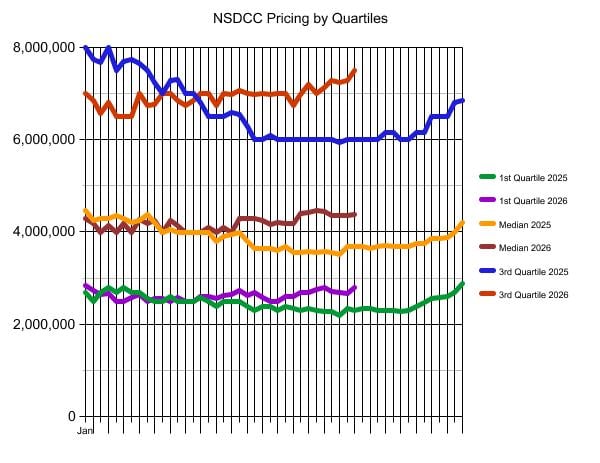
Week | 1st Quartile | Median List Price | 3rd Quartile |
Jan 5 | $2,849,000 | $4,295,000 | $6,999,000 |
Jan 12 | $2,729,000 | $4,175,000 | $6,850,000 |
Jan 19 | $2,650,000 | $3,995,000 | $6,574,000 |
Jan 26 | $2,670,000 | $4,137,500 | $6,800,000 |
Feb 2 | $2,499,999 | $3,995,000 | $6,495,000 |
Feb 9 | $2,500,000 | $4,175,000 | $6,500,000 |
Feb 16 | $2,575,000 | $3,995,000 | $6,500,000 |
Feb 23 | $2,650,000 | $4,272,500 | $6,995,000 |
Mar 2 | $2,498,000 | $4,190,000 | $6,749,000 |
Mar 9 | $2,562,500 | $4,249,500 | $6,772,000 |
Mar 16 | $2,550,000 | $3,999,000 | $6,995,000 |
Mar 23 | $2,500,000 | $4,250,000 | $6,995,000 |
Mar 30 | $2,590,000 | $4,150,000 | $6,850,000 |
Apr 6 | $2,495,000 | $3,995,000 | $6,749,500 |
Apr 13 | $2,500,000 | $3,995,000 | $6,850,000 |
Apr 20 | $2,595,000 | $4,000,000 | $6,995,000 |
Apr 27 | $2,599,000 | $4,100,000 | $6,995,000 |
May 4 | $2,549,000 | $3,995,000 | $6,750,000 |
May 11 | $2,625,000 | $4,100,000 | $6,995,000 |
May 18 | $2,639,999 | $4,000,000 | $6,985,000 |
May 25 | $2,721,500 | $4,291,500 | $7,060,000 |
Jun 1 | $2,625,000 | $4,288,421 | $6,995,000 |
Jun 8 | $2,695,000 | $4,295,000 | $6,990,000 |
Jun 15 | $2,590,000 | $4,249,944 | $6,995,000 |
Jun 22 | $2,498,500 | $4,172,500 | $6,990,000 |
Jun 29 | $2,500,000 | $4,199,000 | $6,995,000 |
Jul 6 | $2,598,944 | $4,195,000 | $6,992,500 |
Jul 13 | $2,600,000 | $4,195,000 | $6,750,000 |
Jul 20 | $2,695,000 | $4,395,000 | $6,990,000 |
Jul 27 | $2,699,000 | $4,417,500 | $7,200,000 |
Aug 3 | $2,757,500 | $4,462,499 | $6,995,000 |
Aug 10 | $2,790,000 | $4,450,000 | $7,122,500 |
Aug 17 | $2,700,000 | $4,350,000 | $7,295,000 |
Aug 24 | $2,699,000 | $4,349,000 | $7,250,000 |
Aug 31 | $2,675,000 | $4,349,000 | $7,295,000 |