Inventory Watch: April 6th
You might think that the world events might be affecting home sales.
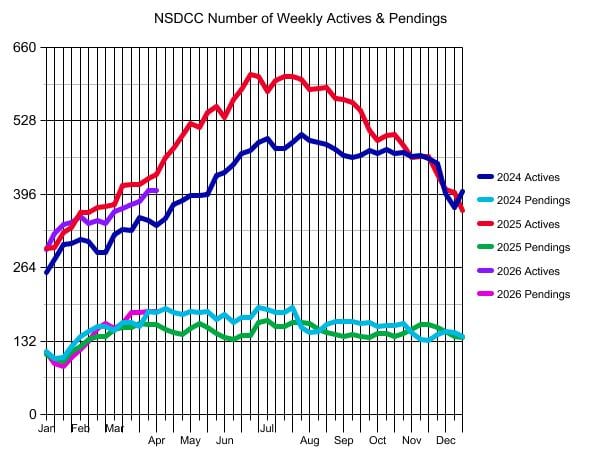
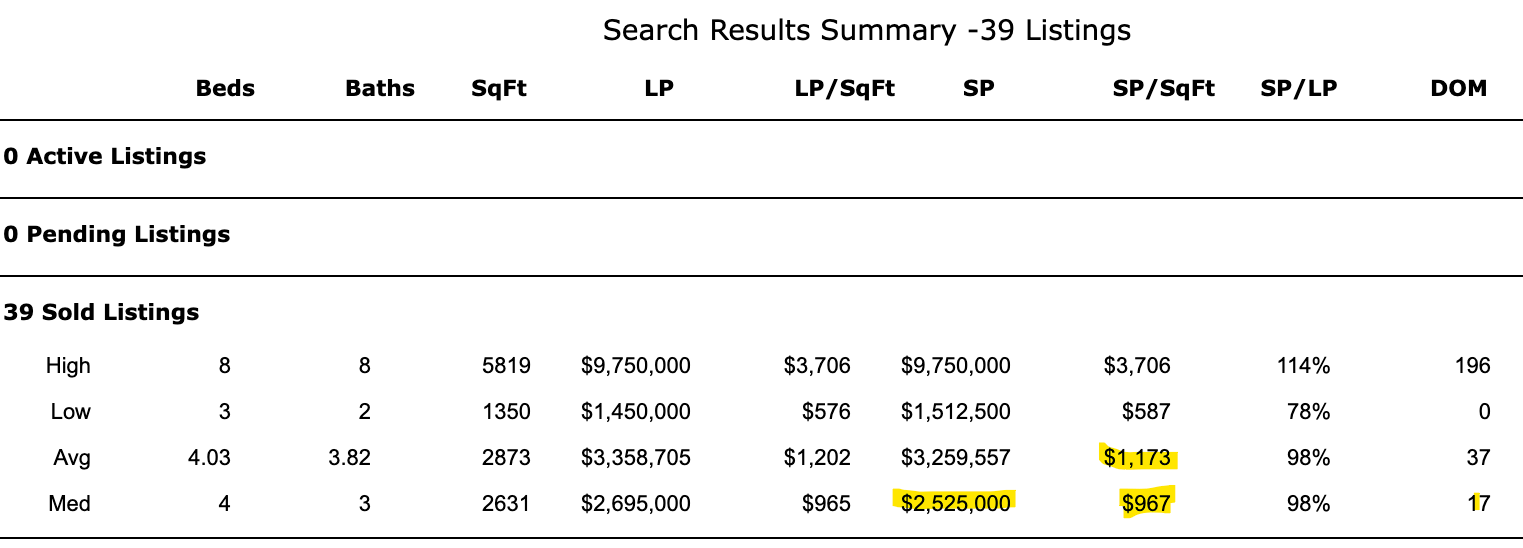
In the last week, the number of NSDCC active listings went down by one, and the pendings count went up by one. All while 39 escrows closed!
Those sales have a familiar look too, statistically.
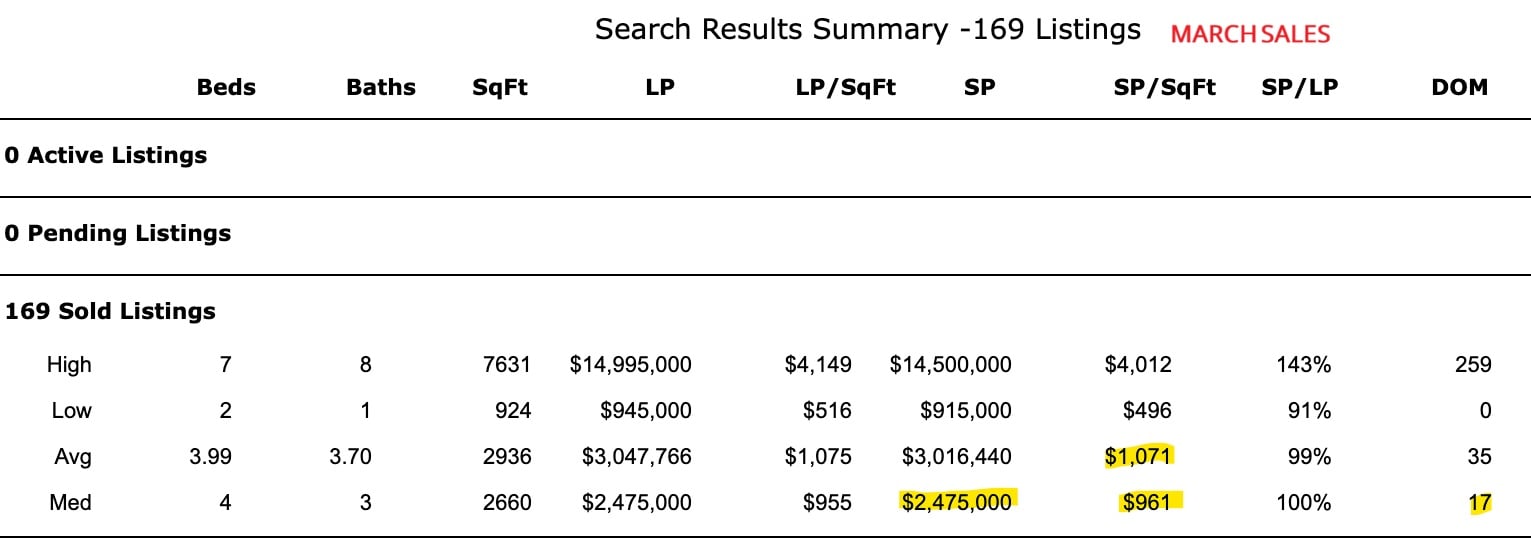
Here are the 39 compared to the 169 NSDCC closings in March:
Let’s check the listings that have gone pending since March 1st – which make up 85% of the total number of pendings – to see if there is any war-time impact:
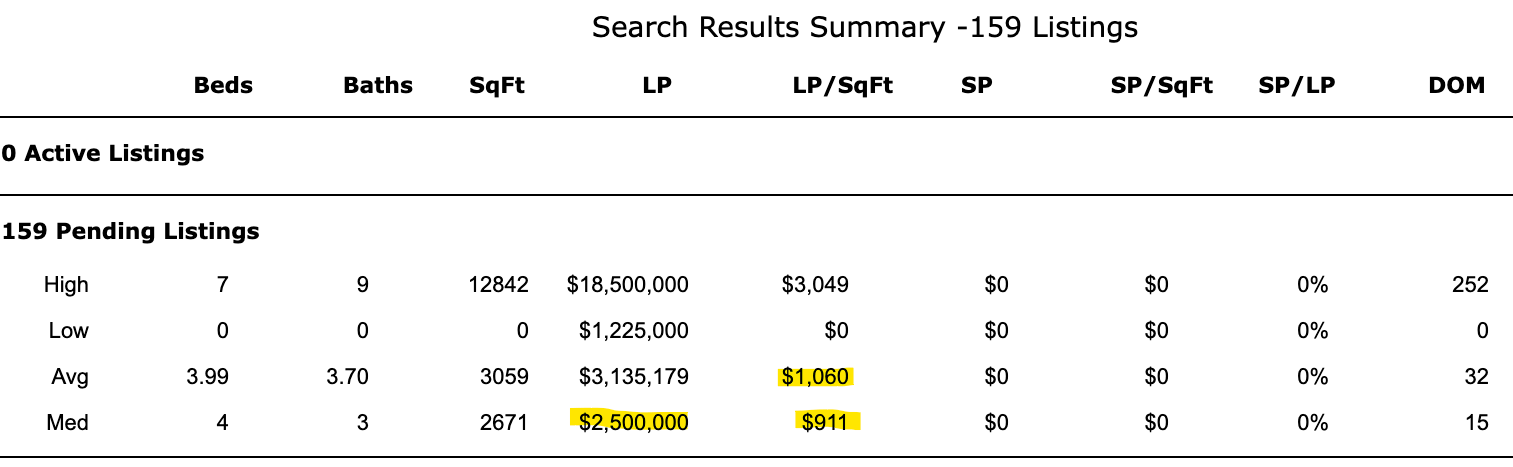
These pendings haven’t closed yet, so their final stats will likely be lower.
It looks like some pricing decline could be ahead.
The $0 – $2,000,000 Market:
| Date |
NSDCC Active Listings |
Avg. LP/sf |
Avg. DOM |
# of Pendings |
| Jan 5, 2026 |
43 |
$855/sf |
50 |
32 |
| Jan 12 |
45 |
$855/sf |
52 |
21 |
| Jan 19 |
49 |
$843/sf |
59 |
22 |
| Jan 26 |
44 |
$836/sf |
50 |
26 |
| Feb 2 |
55 |
$882/sf |
38 |
32 |
| Feb 9 |
50 |
$862/sf |
42 |
36 |
| Feb 16 |
52 |
$848/sf |
36 |
45 |
| Feb 23 |
47 |
$872/sf |
35 |
48 |
| Mar 2 |
54 |
$847/sf |
43 |
43 |
| Mar 9 |
54 |
$860/sf |
37 |
46 |
| Mar 16 |
57 |
$846/sf |
38 |
51 |
| Mar 23 |
57 |
$860/sf |
40 |
46 |
| Mar 30 |
59 |
$893/sf |
42 |
45 |
| Apr 6 |
65 |
$890/sf |
40 |
41 |
The $2,000,000 – $3,000,000 Market:
| Date |
NSDCC Active Listings |
Avg. LP/sf |
Avg. DOM |
# of Pendings |
| Jan 5, 2026 |
45 |
$955/sf |
72 |
26 |
| Jan 12 |
56 |
$981/sf |
59 |
24 |
| Jan 19 |
60 |
$985/sf |
55 |
23 |
| Jan 26 |
65 |
$1,014/sf |
53 |
28 |
| Feb 2 |
67 |
$1,013/sf |
51 |
33 |
| Feb 9 |
69 |
$1,063/sf |
56 |
33 |
| Feb 16 |
68 |
$1,030/sf |
56 |
40 |
| Feb 23 |
66 |
$1,045/sf |
58 |
41 |
| Mar 2 |
76 |
$1,082/sf |
50 |
42 |
| Mar 9 |
74 |
$1,078/sf |
53 |
50 |
| Mar 16 |
77 |
$1,087/sf |
53 |
60 |
| Mar 23 |
79 |
$1,056/sf |
48 |
61 |
| Mar 30 |
84 |
$1,083/sf |
48 |
63 |
| Apr 6 |
83 |
$1,104/sf |
51 |
71 |
The $3,000,000 – $4,000,000 Market:
| Date |
NSDCC Active Listings |
Avg. LP/sf |
Avg. DOM |
# of Pendings |
| Jan 5, 2026 |
56 |
$1,299/sf |
90 |
19 |
| Jan 12 |
62 |
$1,292/sf |
71 |
14 |
| Jan 19 |
65 |
$1,265/sf |
66 |
14 |
| Jan 26 |
63 |
$1,304/sf |
72 |
20 |
| Feb 2 |
60 |
$1,319/sf |
76 |
22 |
| Feb 9 |
51 |
$1,387/sf |
76 |
30 |
| Feb 16 |
58 |
$1,241/sf |
60 |
31 |
| Feb 23 |
52 |
$1,233/sf |
68 |
33 |
| Mar 2 |
50 |
$1,210/sf |
63 |
32 |
| Mar 9 |
54 |
$1,188/sf |
60 |
29 |
| Mar 16 |
57 |
$1,184/sf |
55 |
29 |
| Mar 23 |
53 |
$1,154/sf |
60 |
33 |
| Mar 30 |
58 |
$1,174/sf |
49 |
30 |
| Apr 6 |
61 |
$1,224/sf |
57 |
28 |
The $4,000,000+ Market:
| Date |
NSDCC Active Listings |
Avg. LP/sf |
Avg. DOM |
# of Pendings |
| Jan 5, 2026 |
154 |
$1,927/sf |
127 |
36 |
| Jan 12 |
164 |
$1,896/sf |
119 |
32 |
| Jan 19 |
168 |
$1,858/sf |
115 |
28 |
| Jan 26 |
174 |
$1,906/sf |
113 |
30 |
| Feb 2 |
175 |
$1,892/sf |
109 |
31 |
| Feb 9 |
174 |
$1,842/sf |
103 |
34 |
| Feb 16 |
173 |
$1,863/sf |
108 |
39 |
| Feb 23 |
181 |
$1,883/sf |
110 |
43 |
| Mar 2 |
186 |
$1,853/sf |
109 |
40 |
| Mar 9 |
190 |
$1,870/sf |
112 |
40 |
| Mar 16 |
188 |
$1,885/sf |
112 |
45 |
| Mar 23 |
195 |
$1,854/sf |
112 |
47 |
| Mar 30 |
204 |
$1,868/sf |
112 |
49 |
| Apr 6 |
196 |
$1,872/sf |
112 |
48 |
NSDCC Weekly New Listings and New Pendings
| Week |
New Listings |
New Pendings |
Total Actives |
Total Pendings |
| Jan 5 |
24 |
12 |
296 |
112 |
| Jan 12 |
48 |
10 |
325 |
91 |
| Jan 19 |
55 |
22 |
342 |
86 |
| Jan 26 |
44 |
22 |
346 |
103 |
| Feb 2 |
45 |
29 |
356 |
116 |
| Feb 9 |
43 |
30 |
343 |
132 |
| Feb 16 |
55 |
37 |
349 |
154 |
| Feb 23 |
43 |
39 |
344 |
163 |
| Mar 2 |
55 |
26 |
365 |
155 |
| Mar 9 |
57 |
44 |
370 |
164 |
| Mar 16 |
62 |
39 |
377 |
184 |
| Mar 23 |
55 |
33 |
383 |
184 |
| Mar 30 |
56 |
37 |
403 |
185 |
| Apr 6 |
56 |
40 |
402 |
186 |
NSDCC List Price Quartiles
| Week |
1st Quartile |
Median List Price |
3rd Quartile |
| Jan 5 |
$2,849,000 |
$4,295,000 |
$6,999,000 |
| Jan 12 |
$2,729,000 |
$4,175,000 |
$6,850,000 |
| Jan 19 |
$2,650,000 |
$3,995,000 |
$6,574,000 |
| Jan 26 |
$2,670,000 |
$4,137,500 |
$6,800,000 |
| Feb 2 |
$2,499,999 |
$3,995,000 |
$6,495,000 |
| Feb 9 |
$2,500,000 |
$4,175,000 |
$6,500,000 |
| Feb 16 |
$2,575,000 |
$3,995,000 |
$6,500,000 |
| Feb 23 |
$2,650,000 |
$4,272,500 |
$6,995,000 |
| Mar 2 |
$2,498,000 |
$4,190,000 |
$6,749,000 |
| Mar 9 |
$2,562,500 |
$4,249,500 |
$6,772,000 |
| Mar 16 |
$2,550,000 |
$3,999,000 |
$6,995,000 |
| Mar 23 |
$2,500,000 |
$4,250,000 |
$6,995,000 |
| Mar 30 |
$2,590,000 |
$4,150,000 |
$6,850,000 |
| Apr 6 |
$2,495,000 |
$3,995,000 |
$6,749,500 |