
Inventory Watch: March 2nd
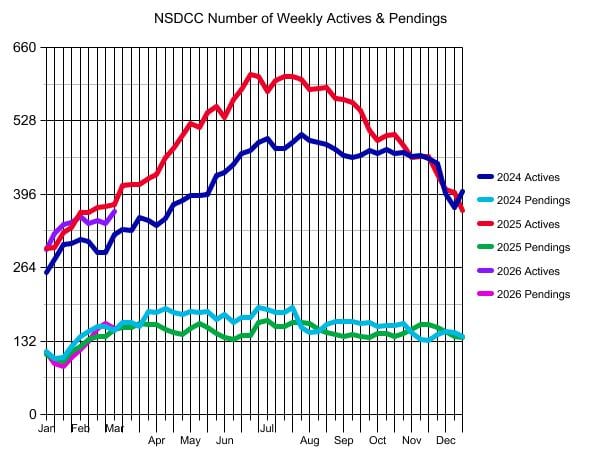
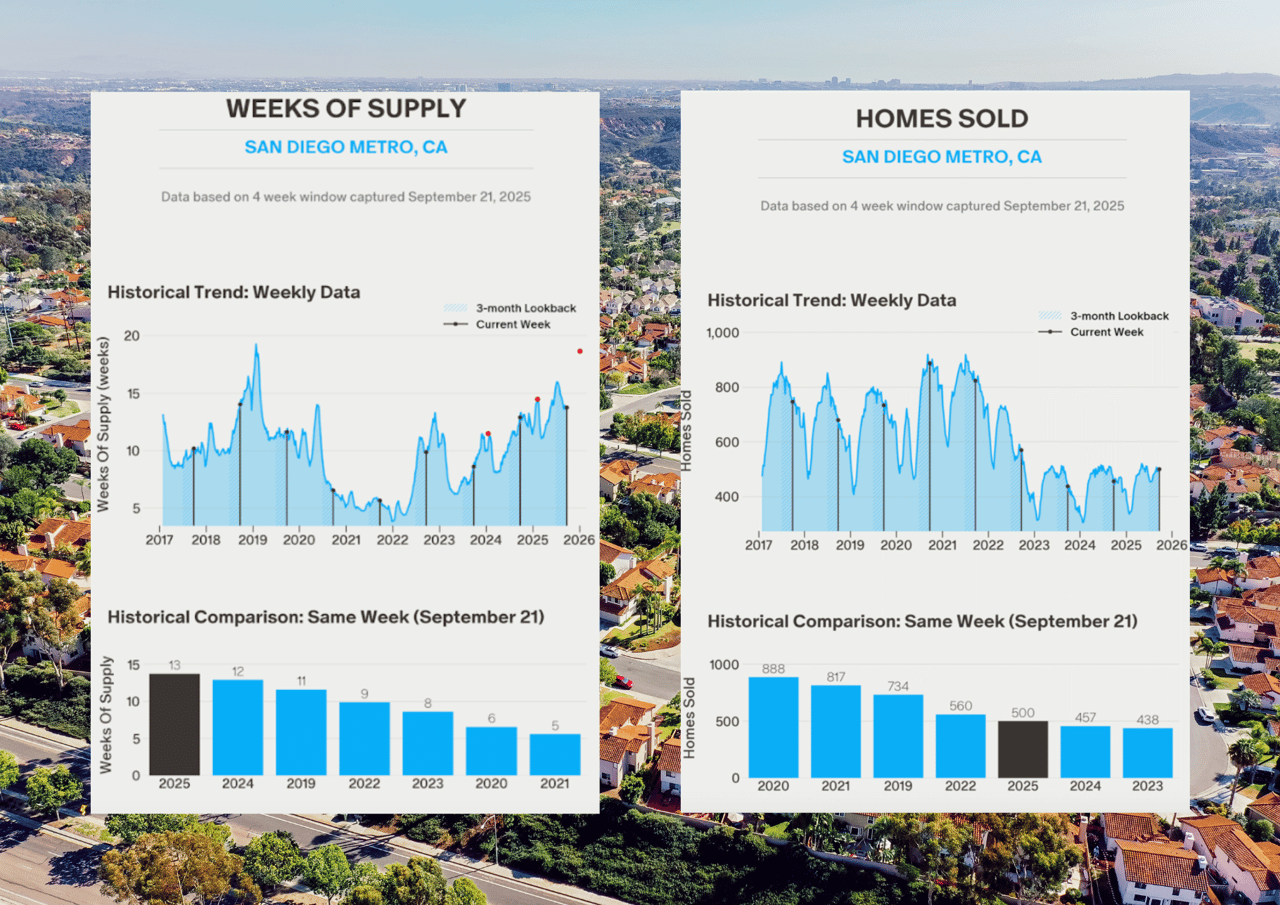
The NSDCC actives count jumped +21 this week and is closing in on last year’s count. The pendings also got in line with previous years too.
Number of Pendings The First Week of March:
2024: 151
2025: 152
2026: 155
Just when the local market is getting back to normal, a war breaks out.
I don’t think there will be much impact on local home sales.
The war is too far away, there’s not much video coverage, and the effective-hit ratio of USA bombs and missiles seems to be around 1,000 to one.
The casual home buyers have already been pensive and they were going to wait a couple of months anyway to see where this goes. But the serious buyers will stay in the hunt because hunkering down is part of their motivation, and that is heightened now.
Sellers who adopt sharp pricing will be ok.
Home sales might slow down a little – like they did last year after Liberation Day?
But that’s probably the worst-case scenario.
The $0 – $2,000,000 Market:
| Date | ||||
| Jan 5, 2026 | ||||
| Jan 12 | ||||
| Jan 19 | ||||
| Jan 26 | ||||
| Feb 2 | ||||
| Feb 9 | ||||
| Feb 16 | ||||
| Feb 23 | ||||
| Mar 2 |
The $2,000,000 – $3,000,000 Market:
| Date | ||||
| Jan 5, 2026 | ||||
| Jan 12 | ||||
| Jan 19 | ||||
| Jan 26 | ||||
| Feb 2 | ||||
| Feb 9 | ||||
| Feb 16 | ||||
| Feb 23 | ||||
| Mar 2 |
The $3,000,000 – $4,000,000 Market:
| Date | ||||
| Jan 5, 2026 | ||||
| Jan 12 | ||||
| Jan 19 | ||||
| Jan 26 | ||||
| Feb 2 | ||||
| Feb 9 | ||||
| Feb 16 | ||||
| Feb 23 | ||||
| Mar 2 |
The $4,000,000+ Market:
| Date | ||||
| Jan 5, 2026 | ||||
| Jan 12 | ||||
| Jan 19 | ||||
| Jan 26 | ||||
| Feb 2 | ||||
| Feb 9 | ||||
| Feb 16 | ||||
| Feb 23 | ||||
| Mar 2 |
NSDCC Weekly New Listings and New Pendings
| Week | ||||
| Jan 5 | ||||
| Jan 12 | ||||
| Jan 19 | ||||
| Jan 26 | ||||
| Feb 2 | ||||
| Feb 9 | ||||
| Feb 16 | ||||
| Feb 23 | ||||
| Mar 2 |
NSDCC List Price Quartiles
| Week | |||
| Jan 5 | |||
| Jan 12 | |||
| Jan 19 | |||
| Jan 26 | |||
| Feb 2 | |||
| Feb 9 | |||
| Feb 16 | |||
| Feb 23 | |||
| Mar 2 |