
Inventory Watch: June 1st
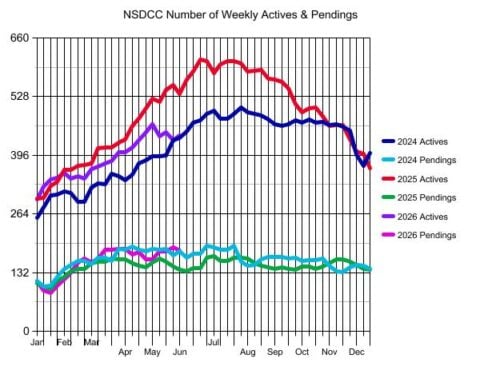
In the past week, we had the fewest new pendings since early January? Yikes!
I don’t think buyers are going to quit altogether in mid-season though.
If there’s not much to get excited about, then they can float in and out of the market. There are plenty of distractions with graduations, vacations, etc.
However, it probably won’t get much better.
I think the rest of 2026 will be sporadic, with roughly 150-ish sales per month out of 400-500 active listings for the foreseeable future.
An occasional hot buy happening amongst a load of sellers who are loitering in the market and just hoping to get lucky!
The $0 – $2,000,000 Market:
Date | NSDCC Active Listings | Avg. LP/sf | Avg. DOM | # of Pendings |
Jan 5, 2026 | 43 | $855/sf | 50 | 32 |
Jan 12 | 45 | $855/sf | 52 | 21 |
Jan 19 | 49 | $843/sf | 59 | 22 |
Jan 26 | 44 | $836/sf | 50 | 26 |
Feb 2 | 55 | $882/sf | 38 | 32 |
Feb 9 | 50 | $862/sf | 42 | 36 |
Feb 16 | 52 | $848/sf | 36 | 45 |
Feb 23 | 47 | $872/sf | 35 | 48 |
Mar 2 | 54 | $847/sf | 43 | 43 |
Mar 9 | 54 | $860/sf | 37 | 46 |
Mar 16 | 57 | $846/sf | 38 | 51 |
Mar 23 | 57 | $860/sf | 40 | 46 |
Mar 30 | 59 | $893/sf | 42 | 45 |
Apr 6 | 65 | $890/sf | 40 | 41 |
Apr 13 | 56 | $885/sf | 44 | 43 |
Apr 20 | 55 | $871/sf | 42 | 49 |
Apr 27 | 56 | $852/sf | 44 | 41 |
May 4 | 63 | $831/sf | 38 | 49 |
May 11 | 59 | $828/sf | 43 | 47 |
May 18 | 60 | $848/sf | 43 | 51 |
May 25 | 48 | $839/sf | 51 | 59 |
Jun 1 | 49 | $846/sf | 53 | 57 |
The $2,000,000 – $3,000,000 Market:
Date | NSDCC Active Listings | Avg. LP/sf | Avg. DOM | # of Pendings |
Jan 5, 2026 | 45 | $955/sf | 72 | 26 |
Jan 12 | 56 | $981/sf | 59 | 24 |
Jan 19 | 60 | $985/sf | 55 | 23 |
Jan 26 | 65 | $1,014/sf | 53 | 28 |
Feb 2 | 67 | $1,013/sf | 51 | 33 |
Feb 9 | 69 | $1,063/sf | 56 | 33 |
Feb 16 | 68 | $1,030/sf | 56 | 40 |
Feb 23 | 66 | $1,045/sf | 58 | 41 |
Mar 2 | 76 | $1,082/sf | 50 | 42 |
Mar 9 | 74 | $1,078/sf | 53 | 50 |
Mar 16 | 77 | $1,087/sf | 53 | 60 |
Mar 23 | 79 | $1,056/sf | 48 | 61 |
Mar 30 | 84 | $1,083/sf | 48 | 63 |
Apr 6 | 83 | $1,104/sf | 51 | 71 |
Apr 13 | 89 | $1,077/sf | 49 | 56 |
Apr 20 | 89 | $1,068/sf | 46 | 53 |
Apr 27 | 95 | $1,073/sf | 46 | 47 |
May 4 | 105 | $1,067/sf | 48 | 45 |
May 11 | 91 | $1,083/sf | 49 | 54 |
May 18 | 89 | $1,102/sf | 52 | 53 |
May 25 | 91 | $1,063/sf | 51 | 53 |
Jun 1 | 98 | $1,079/sf | 49 | 52 |
The $3,000,000 – $4,000,000 Market:
Date | NSDCC Active Listings | Avg. LP/sf | Avg. DOM | # of Pendings |
Jan 5, 2026 | 56 | $1,299/sf | 90 | 19 |
Jan 12 | 62 | $1,292/sf | 71 | 14 |
Jan 19 | 65 | $1,265/sf | 66 | 14 |
Jan 26 | 63 | $1,304/sf | 72 | 20 |
Feb 2 | 60 | $1,319/sf | 76 | 22 |
Feb 9 | 51 | $1,387/sf | 76 | 30 |
Feb 16 | 58 | $1,241/sf | 60 | 31 |
Feb 23 | 52 | $1,233/sf | 68 | 33 |
Mar 2 | 50 | $1,210/sf | 63 | 32 |
Mar 9 | 54 | $1,188/sf | 60 | 29 |
Mar 16 | 57 | $1,184/sf | 55 | 29 |
Mar 23 | 53 | $1,154/sf | 60 | 33 |
Mar 30 | 58 | $1,174/sf | 49 | 30 |
Apr 6 | 61 | $1,224/sf | 57 | 28 |
Apr 13 | 70 | $1,209/sf | 52 | 26 |
Apr 20 | 75 | $1,208/sf | 52 | 28 |
Apr 27 | 75 | $1,184/sf | 56 | 28 |
May 4 | 78 | $1,165/sf | 54 | 24 |
May 11 | 69 | $1,159/sf | 62 | 32 |
May 18 | 76 | $1,211/sf | 69 | 30 |
May 25 | 70 | $1,215/sf | 69 | 31 |
Jun 1 | 67 | $1,196/sf | 72 | 29 |
The $4,000,000+ Market:
Date | NSDCC Active Listings | Avg. LP/sf | Avg. DOM | # of Pendings |
Jan 5, 2026 | 154 | $1,927/sf | 127 | 36 |
Jan 12 | 164 | $1,896/sf | 119 | 32 |
Jan 19 | 168 | $1,858/sf | 115 | 28 |
Jan 26 | 174 | $1,906/sf | 113 | 30 |
Feb 2 | 175 | $1,892/sf | 109 | 31 |
Feb 9 | 174 | $1,842/sf | 103 | 34 |
Feb 16 | 173 | $1,863/sf | 108 | 39 |
Feb 23 | 181 | $1,883/sf | 110 | 43 |
Mar 2 | 186 | $1,853/sf | 109 | 40 |
Mar 9 | 190 | $1,870/sf | 112 | 40 |
Mar 16 | 188 | $1,885/sf | 112 | 45 |
Mar 23 | 195 | $1,854/sf | 112 | 47 |
Mar 30 | 204 | $1,868/sf | 112 | 49 |
Apr 6 | 196 | $1,872/sf | 112 | 48 |
Apr 13 | 201 | $1,826/sf | 114 | 48 |
Apr 20 | 216 | $1,821/sf | 109 | 48 |
Apr 27 | 226 | $1,811/sf | 105 | 46 |
May 4 | 223 | $1,781/sf | 101 | 44 |
May 11 | 223 | $1,782/sf | 104 | 46 |
May 18 | 225 | $1,782/sf | 99 | 45 |
May 25 | 225 | $1,752/sf | 99 | 46 |
Jun 1 | 230 | $1,767/sf | 97 | 43 |
NSDCC Weekly New Listings and New Pendings
Week | New Listings | New Pendings | Total Actives | Total Pendings |
Jan 5 | 24 | 12 | 296 | 112 |
Jan 12 | 48 | 10 | 325 | 91 |
Jan 19 | 55 | 22 | 342 | 86 |
Jan 26 | 44 | 22 | 346 | 103 |
Feb 2 | 45 | 29 | 356 | 116 |
Feb 9 | 43 | 30 | 343 | 132 |
Feb 16 | 55 | 37 | 349 | 154 |
Feb 23 | 43 | 39 | 344 | 163 |
Mar 2 | 55 | 26 | 365 | 155 |
Mar 9 | 57 | 44 | 370 | 164 |
Mar 16 | 62 | 39 | 377 | 184 |
Mar 23 | 55 | 33 | 383 | 184 |
Mar 30 | 56 | 37 | 403 | 185 |
Apr 6 | 56 | 40 | 402 | 186 |
Apr 13 | 55 | 36 | 413 | 172 |
Apr 20 | 63 | 35 | 430 | 178 |
Apr 27 | 69 | 29 | 447 | 162 |
May 4 | 56 | 30 | 465 | 162 |
May 11 | 39 | 41 | 439 | 179 |
May 18 | 53 | 27 | 447 | 179 |
May 25 | 48 | 35 | 430 | 189 |
Jun 1 | 50 | 20 | 440 | 181 |
NSDCC List Price Quartiles
Week | 1st Quartile | Median List Price | 3rd Quartile |
Jan 5 | $2,849,000 | $4,295,000 | $6,999,000 |
Jan 12 | $2,729,000 | $4,175,000 | $6,850,000 |
Jan 19 | $2,650,000 | $3,995,000 | $6,574,000 |
Jan 26 | $2,670,000 | $4,137,500 | $6,800,000 |
Feb 2 | $2,499,999 | $3,995,000 | $6,495,000 |
Feb 9 | $2,500,000 | $4,175,000 | $6,500,000 |
Feb 16 | $2,575,000 | $3,995,000 | $6,500,000 |
Feb 23 | $2,650,000 | $4,272,500 | $6,995,000 |
Mar 2 | $2,498,000 | $4,190,000 | $6,749,000 |
Mar 9 | $2,562,500 | $4,249,500 | $6,772,000 |
Mar 16 | $2,550,000 | $3,999,000 | $6,995,000 |
Mar 23 | $2,500,000 | $4,250,000 | $6,995,000 |
Mar 30 | $2,590,000 | $4,150,000 | $6,850,000 |
Apr 6 | $2,495,000 | $3,995,000 | $6,749,500 |
Apr 13 | $2,500,000 | $3,995,000 | $6,850,000 |
Apr 20 | $2,595,000 | $4,000,000 | $6,995,000 |
Apr 27 | $2,599,000 | $4,100,000 | $6,995,000 |
May 4 | $2,549,000 | $3,995,000 | $6,750,000 |
May 11 | $2,625,000 | $4,100,000 | $6,995,000 |
May 18 | $2,639,999 | $4,000,000 | $6,985,000 |
May 25 | $2,721,500 | $4,291,500 | $7,060,000 |
Jun 1 | $2,625,000 | $4,288,421 | $6,995,000 |