
Inventory Watch: February 6, 2023
The new listings are trickling in but no flood yet – and it’s never been so unlikely that a flood is coming.
There are a few more active listings sitting around unsold, but last year was unusual in how fast homes were selling this early in the season. Today’s buyers are still in shellshock over how few choices there are available (and how high the prices are), so it may take a few weeks before the frenzy is obvious to civilians:
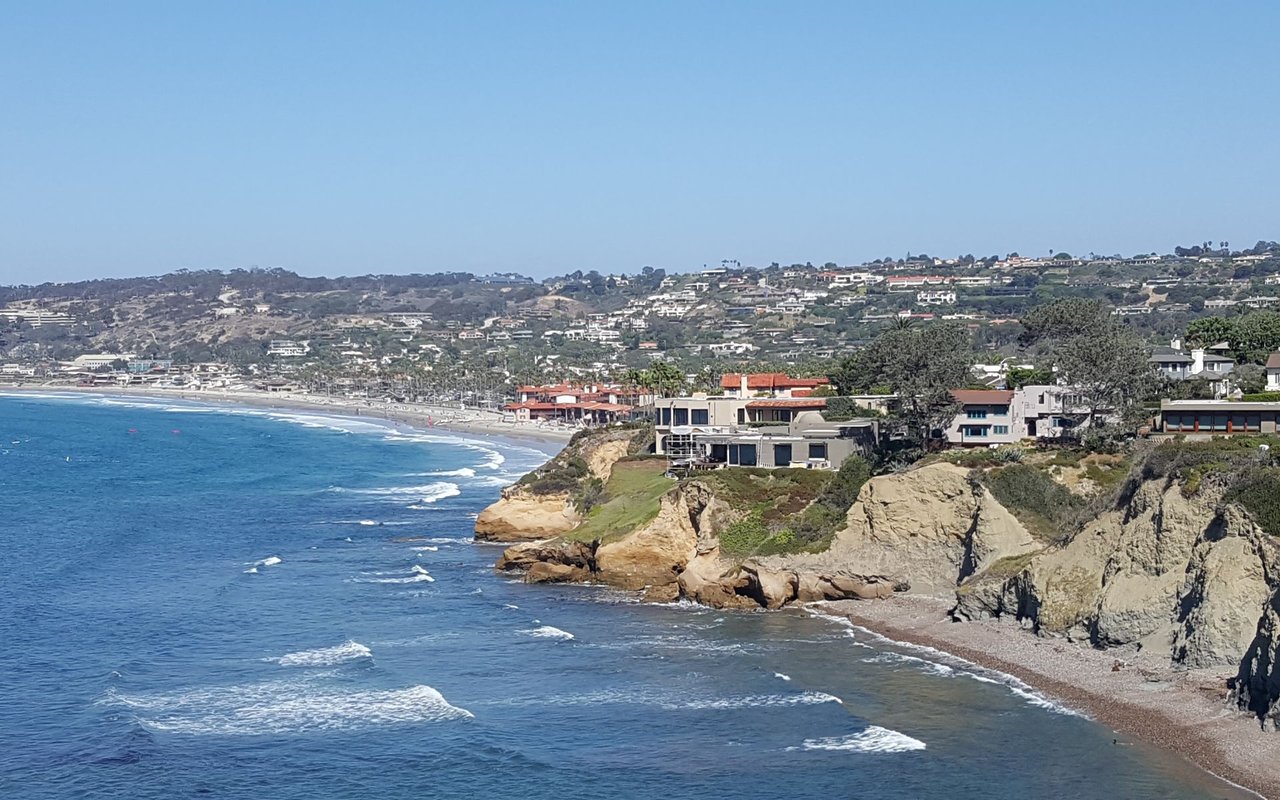
Listings Between La Jolla and Carlsbad
| Year | ||
| 2019 | ||
| 2020 | ||
| 2021 | ||
| 2022 | ||
| 2023 |
There will be a few more January listings inputted this year, but it probably won’t get to 200 – making it the lowest number of January listings ever. Before the pandemic, we regularly had twice as many listings in January as we will have this year.
The scariest part is that these low-inventory conditions will probably continue for years to come.
The $0 – $1,500,000 Market:
| Date | ||||
| Jan 2, 2023 | ||||
| Jan 9 | ||||
| Jan 16 | ||||
| Jan 23 | ||||
| Jan 30 | ||||
| Feb 6 |
The $1,500,000 – $2,000,000 Market:
| Date | ||||
| Jan 2, 2023 | ||||
| Jan 9 | ||||
| Jan 16 | ||||
| Jan 23 | ||||
| Jan 30 | ||||
| Feb 6 |
The $2,000,000 – $3,000,000 Market:
| Date | ||||
| Jan 2, 2023 | ||||
| Jan 9 | ||||
| Jan 16 | ||||
| Jan 23 | ||||
| Jan 30 | ||||
| Feb 6 |
The $3,000,000 – $4,000,000 Market:
| Date | ||||
| Jan 2, 2023 | ||||
| Jan 9 | ||||
| Jan 16 | ||||
| Jan 23 | ||||
| Jan 30 | ||||
| Feb 6 |
The $4,000,000+ Market:
| Date | ||||
| Jan 2, 2023 | ||||
| Jan 9 | ||||
| Jan 16 | ||||
| Jan 23 | ||||
| Jan 30 | ||||
| Feb 6 |
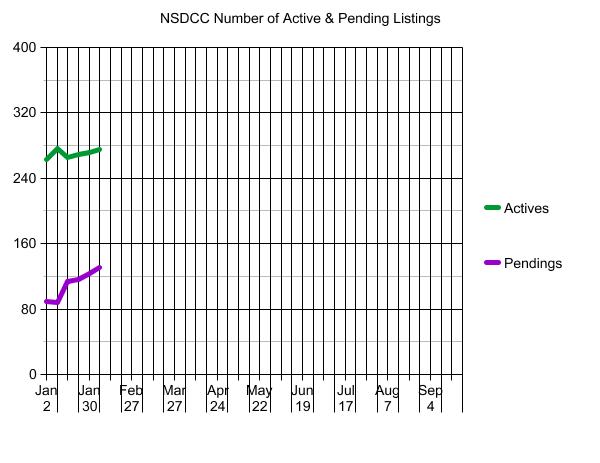
NSDCC Weekly New Listings and New Pendings
| Week | ||||
| Jan 2, 2023 | ||||
| Jan 9 | ||||
| Jan 16 | ||||
| Jan 23 | ||||
| Jan 30 | ||||
| Feb 6 |
NSDCC Weekly LP Quartiles
| Week | |||
| Jan 2, 2023 | |||
| Jan 9 | |||
| Jan 16 | |||
| Jan 23 | |||
| Jan 30 | |||
| Feb 6 |
For previous years, click here: