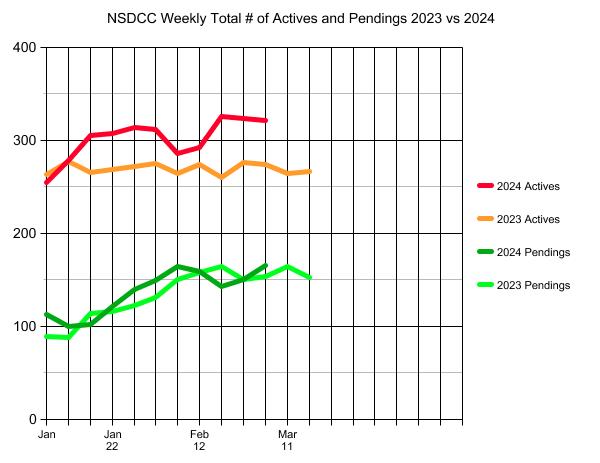
There have been 12% more listings YoY in the first two months of 2024, and buyers are responding!
Closed SFR sales between La Jolla and Carlsbad are +20% YoY in the first two months of the year!
It’s why the number of active listings (red line above) isn’t exploding, AND there have been 88 new pendings in the last two weeks – which is about twice the pace we had in January. The median LP of those 88 pendings is $2.5 million, which means pricing will be at least +10% higher than last year. Wow!
The $0 – $1,500,000 Market:
| Date |
NSDCC Active Listings |
Avg. LP/sf |
Avg. DOM |
# of Pendings |
| Jan 2, 2024 |
15 |
$724/sf |
49 |
23 |
| Jan 8 |
13 |
$645/sf |
58 |
19 |
| Jan 15 |
10 |
$664/sf |
55 |
15 |
| Jan 22 |
15 |
$750/sf |
36 |
15 |
| Jan 29 |
12 |
$834/sf |
36 |
21 |
| Feb 5 |
12 |
$784/sf |
38 |
23 |
| Feb 12 |
10 |
$818/sf |
30 |
22 |
| Feb 19 |
12 |
$731/sf |
17 |
21 |
| Feb 26 |
7 |
$725/sf |
26 |
21 |
| Mar 4 |
9 |
$763/sf |
23 |
21 |
The $1,500,000 – $2,000,000 Market:
| Date |
NSDCC Active Listings |
Avg. LP/sf |
Avg. DOM |
# of Pendings |
| Jan 2, 2024 |
20 |
$866/sf |
66 |
28 |
| Jan 8 |
23 |
$890/sf |
63 |
23 |
| Jan 15 |
32 |
$876/sf |
47 |
35 |
| Jan 22 |
35 |
$823/sf |
43 |
25 |
| Jan 29 |
38 |
$833/sf |
43 |
26 |
| Feb 5 |
39 |
$810/sf |
34 |
28 |
| Feb 12 |
32 |
$781/sf |
39 |
34 |
| Feb 19 |
33 |
$797/sf |
36 |
29 |
| Feb 26 |
33 |
$840/sf |
36 |
31 |
| Mar 4 |
39 |
$827/sf |
32 |
31 |
The $2,000,000 – $3,000,000 Market:
| Date |
NSDCC Active Listings |
Avg. LP/sf |
Avg. DOM |
# of Pendings |
| Jan 2, 2024 |
54 |
$1,046/sf |
65 |
34 |
| Jan 8 |
59 |
$1,034/sf |
57 |
30 |
| Jan 15 |
69 |
$1,094/sf |
44 |
35 |
| Jan 22 |
60 |
$1,108/sf |
42 |
45 |
| Jan 29 |
65 |
$1,126/sf |
41 |
48 |
| Feb 5 |
68 |
$1,120/sf |
31 |
50 |
| Feb 12 |
60 |
$1,123/sf |
34 |
56 |
| Feb 19 |
71 |
$1,130/sf |
29 |
56 |
| Feb 26 |
64 |
$1,138/sf |
30 |
61 |
| Mar 4 |
61 |
$1,211/sf |
29 |
62 |
The $3,000,000 – $4,000,000 Market:
| Date |
NSDCC Active Listings |
Avg. LP/sf |
Avg. DOM |
# of Pendings |
| Jan 2, 2024 |
33 |
$1,216/sf |
92 |
15 |
| Jan 8 |
37 |
$1,248/sf |
83 |
15 |
| Jan 15 |
42 |
$1,236/sf |
77 |
18 |
| Jan 22 |
43 |
$1,283/sf |
77 |
17 |
| Jan 29 |
42 |
$1,242/sf |
75 |
20 |
| Feb 5 |
36 |
$1,363/sf |
73 |
25 |
| Feb 12 |
40 |
$1,252/sf |
34 |
18 |
| Feb 19 |
47 |
$1,515/sf |
45 |
17 |
| Feb 26 |
50 |
$1,512/sf |
42 |
16 |
| Mar 4 |
50 |
$1,588/sf |
44 |
19 |
The $4,000,000+ Market:
| Date |
NSDCC Active Listings |
Avg. LP/sf |
Avg. DOM |
# of Pendings |
| Jan 2, 2024 |
139 |
$1,858/sf |
116 |
20 |
| Jan 8 |
151 |
$1,896/sf |
109 |
18 |
| Jan 15 |
157 |
$1,879/sf |
106 |
22 |
| Jan 22 |
159 |
$1,824/sf |
104 |
27 |
| Jan 29 |
162 |
$1,758/sf |
108 |
31 |
| Feb 5 |
162 |
$1,718/sf |
108 |
30 |
| Feb 12 |
154 |
$1,705/sf |
107 |
34 |
| Feb 19 |
168 |
$1,685/sf |
107 |
24 |
| Feb 26 |
175 |
$1,691/sf |
105 |
26 |
| Mar 4 |
166 |
$1,692/sf |
97 |
36 |
NSDCC Weekly New Listings and New Pendings
| Week |
New Listings |
New Pendings |
Total Actives |
Total Pendings |
| Jan 2, 2024 |
18 |
10 |
255 |
113 |
| Jan 8 |
43 |
12 |
278 |
100 |
| Jan 15 |
52 |
20 |
305 |
102 |
| Jan 22 |
50 |
29 |
308 |
122 |
| Jan 29 |
44 |
32 |
314 |
140 |
| Feb 5 |
44 |
33 |
312 |
149 |
| Feb 12 |
37 |
34 |
292 |
159 |
| Feb 19 |
53 |
24 |
326 |
143 |
| Feb 26 |
45 |
37 |
324 |
151 |
| Mar 4 |
52 |
45 |
332 |
166 |
NSDCC List Price Quartiles
| Week |
1st Quartile |
Median List Price |
3rd Quartile |
| Jan 2, 2024 |
$2,549,888 |
$4,444,000 |
$8,350,000 |
| Jan 8 |
$2,572,444 |
$4,447,000 |
$8,097,500 |
| Jan 15 |
$2,499,000 |
$4,200,000 |
$7,950,000 |
| Jan 22 |
$2,429,000 |
$4,250,000 |
$7,450,000 |
| Jan 29 |
$2,399,000 |
$4,225,000 |
$7,495,000 |
| Feb 5 |
$2,398,000 |
$4,272,500 |
$7,495,000 |
| Feb 12 |
$2,499,800 |
$4,297,500 |
$7,495,000 |
| Feb 19 |
$2,499,400 |
$4,200,000 |
$6,972,500 |
| Feb 26 |
$2,649,400 |
$4,350,000 |
$7,300,000 |
| Mar 4 |
$2,525,000 |
$4,225,000 |
$7,149,500 |