Inventory Watch: July 3, 2023
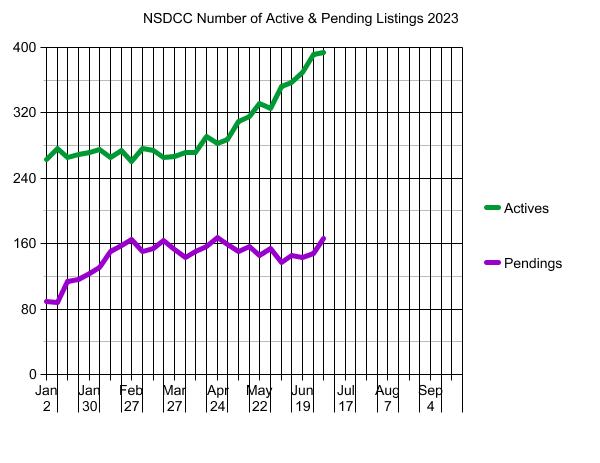
The number of pendings surged with the largest weekly gain of the year – 48 detached-home sales between La Jolla and Carlsbad opened escrow since last Monday! This year’s previous weekly high was 39.
There should be another 2-3 weeks of heightened activity as buyers scramble to secure a home and get comfortable before school starts. We have three new listings coming – stay tuned!
The $0 – $1,500,000 Market:
| Date |
NSDCC Active Listings |
Avg. LP/sf |
Avg. DOM |
# of Pendings |
| Jan 2, 2023 |
22 |
$719/sf |
75 |
15 |
| Jan 9 |
26 |
$687/sf |
50 |
14 |
| Jan 16 |
23 |
$701/sf |
52 |
20 |
| Jan 23 |
25 |
$751/sf |
60 |
21 |
| Jan 30 |
23 |
$788/sf |
45 |
25 |
| Feb 6 |
18 |
$750/sf |
59 |
24 |
| Feb 13 |
18 |
$770/sf |
48 |
26 |
| Feb 20 |
17 |
$778/sf |
49 |
26 |
| Feb 27 |
18 |
$802/sf |
48 |
23 |
| Mar 6 |
22 |
$802/sf |
44 |
14 |
| Mar 13 |
22 |
$747/sf |
45 |
16 |
| Mar 20 |
16 |
$826/sf |
49 |
21 |
| Mar 27 |
17 |
$853/sf |
47 |
20 |
| Apr 3 |
19 |
$803/sf |
37 |
20 |
| Apr 10 |
11 |
$778/sf |
53 |
30 |
| Apr 17 |
15 |
$690/sf |
44 |
27 |
| Apr 24 |
12 |
$682/sf |
33 |
25 |
| May 1 |
11 |
$795/sf |
35 |
27 |
| May 8 |
14 |
$780/sf |
33 |
24 |
| May 15 |
16 |
$770/sf |
37 |
22 |
| May 22 |
21 |
$747/sf |
45 |
18 |
| May 29 |
20 |
$757/sf |
52 |
21 |
| Jun 5 |
23 |
$755/sf |
49 |
20 |
| Jun 12 |
17 |
$711/sf |
31 |
32 |
| Jun 19 |
16 |
$674/sf |
34 |
33 |
| Jun 26 |
20 |
$677/sf |
32 |
29 |
| Jul 3 |
21 |
$645/sf |
28 |
33 |
The $1,500,000 – $2,000,000 Market:
| Date |
NSDCC Active Listings |
Avg. LP/sf |
Avg. DOM |
# of Pendings |
| Jan 2, 2023 |
45 |
$809/sf |
60 |
18 |
| Jan 9 |
55 |
$828/sf |
53 |
19 |
| Jan 16 |
46 |
$838/sf |
53 |
30 |
| Jan 23 |
43 |
$793/sf |
52 |
31 |
| Jan 30 |
40 |
$778/sf |
54 |
34 |
| Feb 6 |
42 |
$814/sf |
46 |
30 |
| Feb 13 |
35 |
$823/sf |
51 |
39 |
| Feb 20 |
34 |
$801/sf |
47 |
40 |
| Feb 27 |
27 |
$846/sf |
33 |
45 |
| Mar 6 |
29 |
$893/sf |
33 |
41 |
| Mar 13 |
32 |
$850/sf |
33 |
39 |
| Mar 20 |
27 |
$872/sf |
36 |
41 |
| Mar 27 |
22 |
$832/sf |
39 |
36 |
| Apr 3 |
21 |
$779/sf |
27 |
36 |
| Apr 10 |
22 |
$816/sf |
26 |
33 |
| Apr 17 |
27 |
$797/sf |
21 |
33 |
| Apr 24 |
28 |
$856/sf |
31 |
34 |
| Apr 24 |
28 |
$856/sf |
31 |
34 |
| May 1 |
30 |
$789/sf |
28 |
36 |
| May 8 |
36 |
$808/sf |
25 |
37 |
| May 15 |
33 |
$776/sf |
33 |
44 |
| May 22 |
35 |
$818/sf |
36 |
44 |
| May 29 |
38 |
$786/sf |
33 |
40 |
| Jun 5 |
39 |
$791/sf |
34 |
30 |
| Jun 12 |
37 |
$754/sf |
37 |
32 |
| Jun 19 |
36 |
$779/sf |
35 |
35 |
| Jun 26 |
39 |
$766/sf |
34 |
36 |
| Jul 3 |
39 |
$776/sf |
41 |
40 |
The $2,000,000 – $3,000,000 Market:
| Date |
NSDCC Active Listings |
Avg. LP/sf |
Avg. DOM |
# of Pendings |
| Jan 2, 2023 |
52 |
$869/sf |
69 |
30 |
| Jan 9 |
57 |
$940/sf |
66 |
31 |
| Jan 16 |
50 |
$948/sf |
61 |
36 |
| Jan 23 |
51 |
$949/sf |
58 |
35 |
| Jan 30 |
54 |
$964/sf |
55 |
34 |
| Feb 6 |
60 |
$930/sf |
51 |
42 |
| Feb 13 |
51 |
$1,038/sf |
52 |
47 |
| Feb 20 |
58 |
$1,022/sf |
47 |
46 |
| Feb 27 |
56 |
$1,064/sf |
52 |
49 |
| Mar 6 |
57 |
$995/sf |
50 |
50 |
| Mar 13 |
55 |
$1,015/sf |
53 |
47 |
| Mar 20 |
50 |
$1,011/sf |
58 |
50 |
| Mar 27 |
54 |
$1,039/sf |
49 |
47 |
| Apr 3 |
54 |
$1,035/sf |
52 |
38 |
| Apr 10 |
55 |
$1,004/sf |
48 |
42 |
| Apr 17 |
64 |
$985/sf |
47 |
46 |
| Apr 24 |
57 |
$1,001/sf |
43 |
50 |
| May 1 |
57 |
$1,008/sf |
42 |
45 |
| May 8 |
68 |
$1,031/sf |
36 |
41 |
| May 15 |
71 |
$1,007/sf |
34 |
39 |
| May 22 |
77 |
$1,003/sf |
34 |
38 |
| May 29 |
74 |
$1,002/sf |
39 |
43 |
| Jun 5 |
77 |
$991/sf |
42 |
44 |
| Jun 12 |
82 |
$986/sf |
48 |
45 |
| Jun 19 |
90 |
$978/sf |
48 |
33 |
| Jun 26 |
90 |
$1,015/sf |
49 |
33 |
| Jul 3 |
92 |
$1,019/sf |
49 |
36 |
The $3,000,000 – $4,000,000 Market:
| Date |
NSDCC Active Listings |
Avg. LP/sf |
Avg. DOM |
# of Pendings |
| Jan 2, 2023 |
29 |
$1,236/sf |
85 |
6 |
| Jan 9 |
29 |
$1,180/sf |
80 |
5 |
| Jan 16 |
31 |
$1,196/sf |
73 |
8 |
| Jan 23 |
33 |
$1,201/sf |
71 |
7 |
| Jan 30 |
37 |
$1,218/sf |
70 |
6 |
| Feb 6 |
34 |
$1,236/sf |
75 |
12 |
| Feb 13 |
43 |
$1,333/sf |
68 |
11 |
| Feb 20 |
39 |
$1,392/sf |
71 |
18 |
| Feb 27 |
37 |
$1,323/sf |
68 |
22 |
| Mar 6 |
49 |
$1,222/sf |
56 |
20 |
| Mar 13 |
49 |
$1,312/sf |
49 |
22 |
| Mar 20 |
46 |
$1,321/sf |
52 |
25 |
| Mar 27 |
50 |
$1,329/sf |
52 |
25 |
| Apr 3 |
49 |
$1,342/sf |
51 |
23 |
| Apr 10 |
50 |
$1,321/sf |
57 |
24 |
| Apr 17 |
47 |
$1,342/sf |
59 |
26 |
| Apr 24 |
49 |
$1,281/sf |
63 |
28 |
| May 1 |
53 |
$1,227/sf |
62 |
23 |
| May 8 |
55 |
$1,122/sf |
63 |
19 |
| May 15 |
57 |
$1,211/sf |
59 |
19 |
| May 22 |
59 |
$1,170/sf |
61 |
19 |
| May 29 |
60 |
$1,171/sf |
60 |
17 |
| Jun 5 |
70 |
$1,178/sf |
55 |
15 |
| Jun 12 |
64 |
$1,198/sf |
53 |
18 |
| Jun 19 |
67 |
$1,184/sf |
54 |
20 |
| Jun 26 |
66 |
$1,204/sf |
58 |
25 |
| Jul 3 |
63 |
$1,215/sf |
58 |
22 |
The $4,000,000+ Market:
| Date |
NSDCC Active Listings |
Avg. LP/sf |
Avg. DOM |
# of Pendings |
| Jan 2, 2023 |
121 |
$1,744/sf |
126 |
21 |
| Jan 9 |
119 |
$1,716/sf |
123 |
20 |
| Jan 16 |
120 |
$1,761/sf |
121 |
26 |
| Jan 23 |
122 |
$1,707/sf |
119 |
27 |
| Jan 30 |
120 |
$1,680/sf |
121 |
30 |
| Feb 6 |
125 |
$1,714/sf |
118 |
28 |
| Feb 13 |
121 |
$1,750/sf |
116 |
32 |
| Feb 20 |
129 |
$1,725/sf |
112 |
33 |
| Feb 27 |
124 |
$1,743/sf |
115 |
31 |
| Mar 6 |
122 |
$1,753/sf |
109 |
28 |
| Mar 13 |
120 |
$1,782/sf |
109 |
32 |
| Mar 20 |
129 |
$1,783/sf |
106 |
28 |
| Mar 27 |
127 |
$1,781/sf |
106 |
27 |
| Apr 3 |
131 |
$1,774/sf |
105 |
27 |
| Apr 10 |
136 |
$1,788/sf |
107 |
24 |
| Apr 17 |
140 |
$1,776/sf |
108 |
27 |
| Apr 24 |
141 |
$1,771/sf |
107 |
31 |
| May 1 |
142 |
$1,760/sf |
105 |
30 |
| May 8 |
140 |
$1,737/sf |
104 |
32 |
| May 15 |
141 |
$1,812/sf |
107 |
37 |
| May 22 |
145 |
$1,816/sf |
106 |
29 |
| May 29 |
142 |
$1,846/sf |
110 |
36 |
| Jun 5 |
152 |
$1,791/sf |
107 |
31 |
| Jun 12 |
163 |
$1,777/sf |
106 |
24 |
| Jun 19 |
166 |
$1,779/sf |
102 |
26 |
| Jun 26 |
179 |
$1,758/sf |
98 |
29 |
| Jul 3 |
184 |
$1,670/sf |
91 |
39 |
NSDCC Weekly New Listings and New Pendings
| Week |
New Listings |
New Pendings |
Total Actives |
Total Pendings |
| Jan 2, 2023 |
11 |
6 |
263 |
89 |
| Jan 9 |
36 |
15 |
277 |
88 |
| Jan 16 |
36 |
34 |
266 |
114 |
| Jan 23 |
36 |
22 |
269 |
116 |
| Jan 30 |
32 |
25 |
272 |
123 |
| Feb 6 |
46 |
33 |
275 |
131 |
| Feb 13 |
30 |
35 |
265 |
150 |
| Feb 20 |
43 |
34 |
274 |
158 |
| Feb 27 |
27 |
30 |
260 |
165 |
| Mar 6 |
45 |
28 |
276 |
150 |
| Mar 13 |
38 |
38 |
274 |
154 |
| Mar 20 |
39 |
37 |
265 |
164 |
| Mar 27 |
36 |
25 |
267 |
153 |
| Apr 3 |
37 |
28 |
271 |
143 |
| Apr 10 |
36 |
39 |
272 |
151 |
| Apr 17 |
47 |
27 |
291 |
157 |
| Apr 24 |
46 |
41 |
282 |
167 |
| May 1 |
59 |
31 |
288 |
159 |
| May 8 |
53 |
26 |
310 |
151 |
| May 15 |
48 |
31 |
315 |
157 |
| May 22 |
50 |
24 |
332 |
145 |
| May 29 |
43 |
37 |
325 |
154 |
| Jun 5 |
43 |
17 |
352 |
137 |
| Jun 12 |
52 |
36 |
357 |
146 |
| Jun 19 |
48 |
30 |
369 |
143 |
| Jun 26 |
65 |
26 |
391 |
148 |
| Jul 3 |
60 |
48 |
394 |
166 |
NSDCC Weekly LP Quartiles
| Week |
1st Quartile |
2nd Quartile (Median LP) |
3rd Quartile |
| Jan 2, 2023 |
$2,095,000 |
$3,695,000 |
$5,995,000 |
| Jan 9 |
$1,990,000 |
$3,495,000 |
$5,775,000 |
| Jan 16 |
$2,000,000 |
$3,574,000 |
$5,995,000 |
| Jan 23 |
$2,099,000 |
$3,595,000 |
$5,999,000 |
| Jan 30 |
$2,195,000 |
$3,525,000 |
$5,942,000 |
| Feb 6 |
$2,195,000 |
$3,598,000 |
$6,845,000 |
| Feb 13 |
$2,300,000 |
$3,795,000 |
$6,495,000 |
| Feb 20 |
$2,397,500 |
$3,950,000 |
$6,197,500 |
| Feb 27 |
$2,480,800 |
$3,970,000 |
$6,845,000 |
| Mar 6 |
$2,395,000 |
$3,749,500 |
$5,995,000 |
| Mar 13 |
$2,397,000 |
$3,772,500 |
$5,997,000 |
| Mar 20 |
$2,580,000 |
$3,995,000 |
$6,800,000 |
| Mar 27 |
$2,595,000 |
$3,995,000 |
$6,845,000 |
| Apr 3 |
$2,699,000 |
$3,995,000 |
$6,750,000 |
| Apr 10 |
$2,799,500 |
$4,074,997 |
$6,895,000 |
| Apr 17 |
$2,600,000 |
$3,995,000 |
$6,597,000 |
| Apr 24 |
$2,685,000 |
$4,074,997 |
$6,895,000 |
| May 1 |
$2,695,000 |
$3,999,000 |
$6,495,000 |
| May 8 |
$2,525,000 |
$3,849,949 |
$5,946,000 |
| May 15 |
$2,495,000 |
$3,749,400 |
$5,950,000 |
| May 22 |
$2,444,000 |
$3,695,400 |
$6,000,000 |
| May 29 |
$2,495,000 |
$3,699,000 |
$6,395,000 |
| Jun 5 |
$2,450,000 |
$3,641,500 |
$6,000,000 |
| Jun 12 |
$2,499,900 |
$3,799,999 |
$6,496,000 |
| Jun 19 |
$2,495,000 |
$3,750,000 |
$6,497,000 |
| Jun 26 |
$2,450,000 |
$3,799,000 |
$6,495,000 |
| Jul 3 |
$2,479,000 |
$3,891,500 |
$6,235,000 |